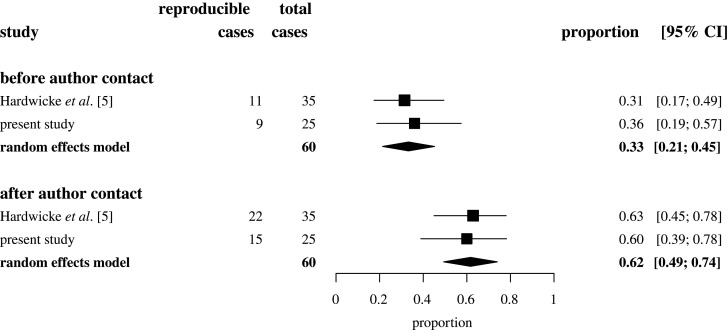
Figure 1.
Forest plot showing the proportion of articles with fully reproducible target values in Hardwicke et al. [5] and the present study before and after contacting original authors for assistance with reproducibility checks. Squares represent individual study proportions. Diamonds represent summary proportions estimated by random effects models. Error bars represent 95% confidence intervals (CIs).

