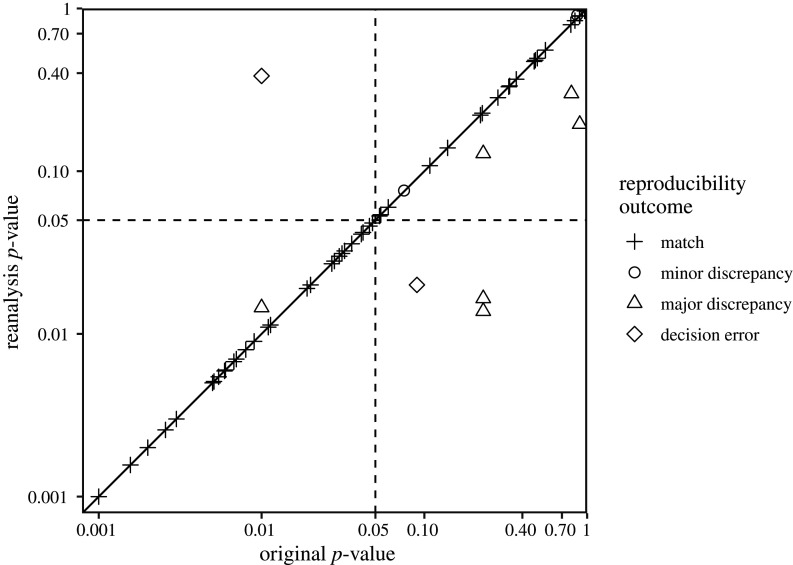
Figure 2.
Scatterplot showing reanalysis p-values as a function of original p-values, classified by reproducibility outcome. Axes are on a log scale. The diagonal line represents perfect consistency between reanalysis and original values. Dashed lines represent the typical alpha threshold (0.05) for statistical significance. Original values reported relative to thresholds (e.g. p < 0.05) are represented by the threshold value when there was a major discrepancy and represented by the reanalysis value when there was a match. For display purposes, 41 values below 0.001 are not shown. Note that the two values in the bottom right quadrant of the graph have been conservatively designated as ‘major errors' rather than ‘decision errors' due to uncertainty about how the original analysis was performed. Specifically, insufficient information was provided in the original article (ID 9-5-2014_PS) about how multiplicity corrections were applied (see Vignette 25 in electronic supplementary material, section E for further information).

