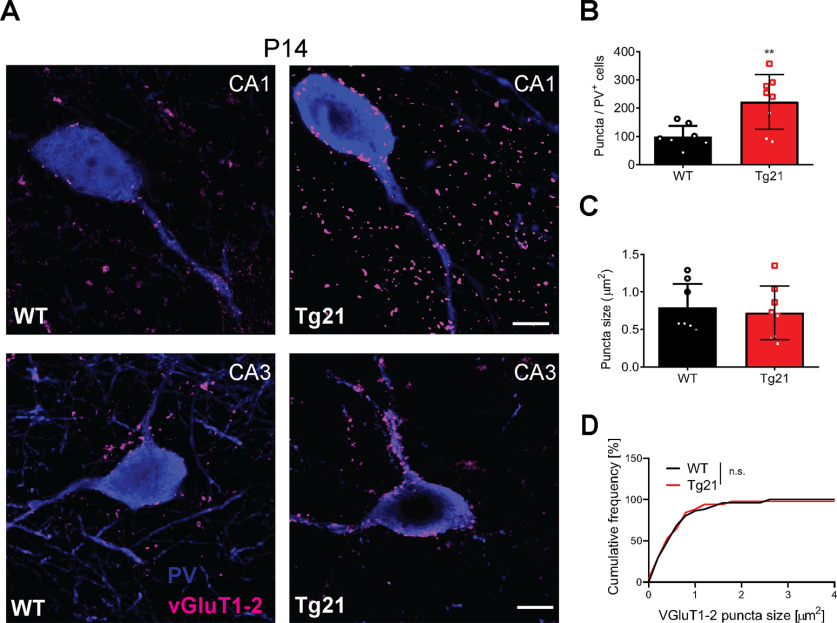
Figure 8.
Increased density of glutamatergic terminals on PV+ interneurons of Tg21 mice at P14. A, Representative images of double immunofluorescence staining for VGluT1-2 (magenta) and PV (blue) in hippocampus of WT and Tg21 mice. B, Quantification of VGluT1&2+ puncta in PV+ cells, showing higher numbers in Tg21 mice. C, D, No change in puncta size between genotypes was observed. Bar graphs are given as mean ± SD, N = 4 animals per genotype and 2 hippocampi per animal. 10 to 15 PV+ cells were quantified per hippocampi and area. Student’s t test, **p, 0.01, KS tests n.s. Scale bar: 10 mm.

