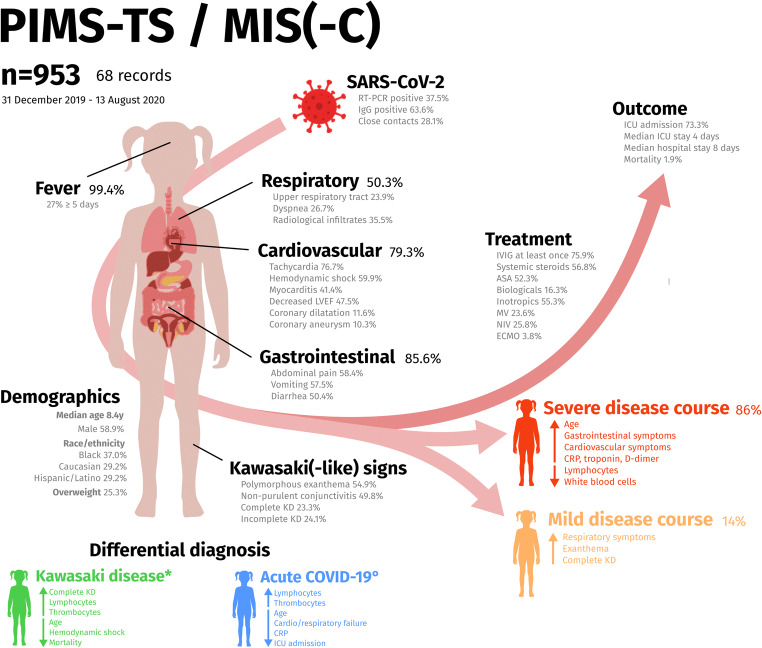
Fig. 5.
Summary figure presenting the findings of this systematic review on the clinical spectrum of PIMS-TS/MIS(-C). Comparison of the clinical picture is made, based on relevant differences with control populations such as published on Kawasaki disease (KD) by Pouletty et al. [64] and Whittaker et al. [15] (*), and non-PIMS-TS/MIS(-C) pediatric COVID-19 by Swann et al. [23] (°). For each variable, the percentage denoting the fraction of included cases is displayed. PIMS-TS/MIS(-C) disease severity is assessed as described in the “Methods” section. Arrows pointing upwards mean that a higher proportion of cases display one of the mentioned symptoms or that higher values for the laboratory markers are found. Arrows pointing down denote lower values or frequencies

