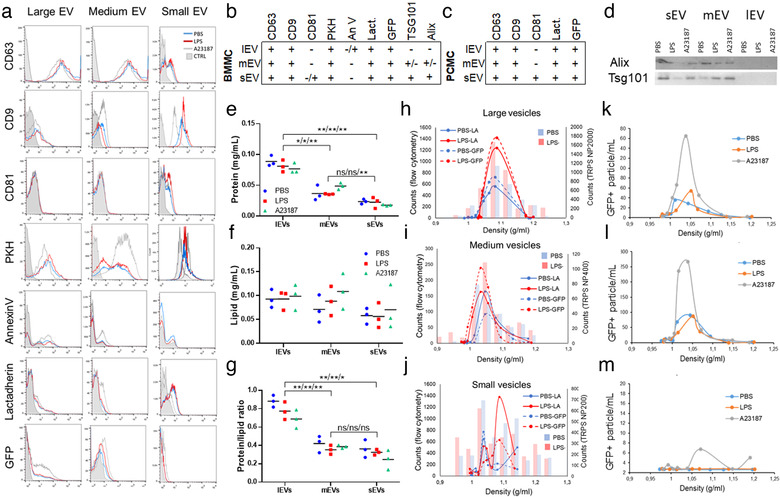
FIGURE 4.

Characterization of mast cell‐derived EV populations. Large, medium and small EVs derived from 100 ng/ml LPS‐stimulated (LPS) or unstimulated (PBS) BMMCs and PCMCs were tested by flow cytometry. A23187 (0.5 μM) was used as positive control. EVs were stained for CD63, CD9 and CD81 or labelled with fluorochrome‐conjugated PKH67, annexin V and lactadherin. GFP expression of EVs derived from C57BL‐GFP mice were also measured. Small EVs were bound onto the surface of aldehyde/sulphate beads (4 μm). Histograms of flow cytometry measurements show single demonstrates of at least three independent experiments with BMMCs (a, n>3). Tables summarize the results on BMMC (b)‐and PCMC (c)‐derived EVs. Exosome markers Alix and TSG101 were detected by Western blot on the 3 × 3 EV populations (d). Protein (e) and lipid (f) content of separated EVs were measured by microBCA protein and SPV lipid assays, respectively. Protein/lipid ratio was also calculated (g). Graphs demonstrate three independent biological replicates (n = 3, *P ≤ 0.05, **P ≤ 0.01, t test). An Optiprep gradient was used to further characterize EVs. Separated small, medium and lEVs from the conditioned medium of BMMCs (from C57BL‐GFP) were ultracentrifuged (<16h, 100,000g, 4°C) bottom up (h‐j), while cell‐free conditioned medium of PCMCs (from C57BL‐GFP) were layered on the top of an Optiprep gradient (k‐m). Particle number was determined by TRPS and their lactadherin binding and positivity for GFP were determined by flow cytometry. Graphs show means of 3 independent experiments (n = 3)
