FIGURE 6.

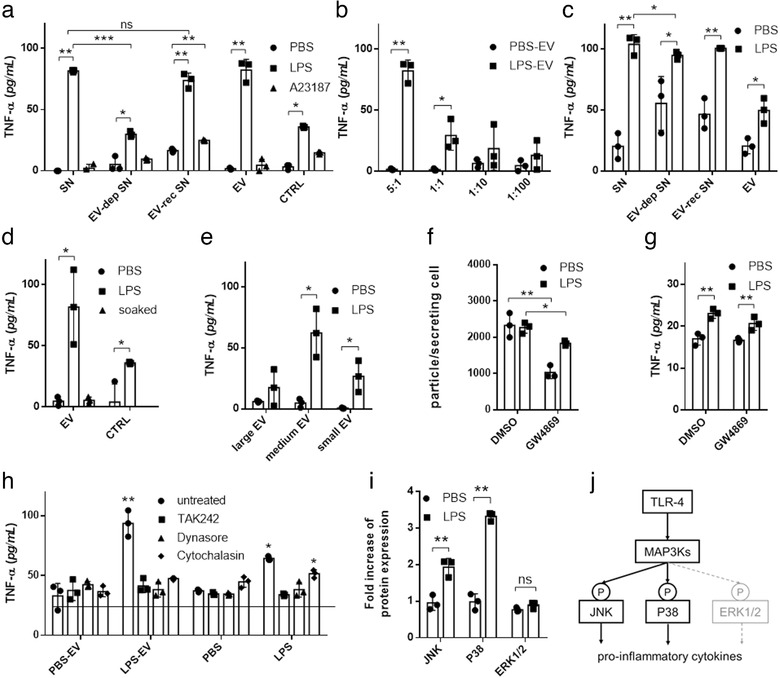
EVs from LPS‐stimulated MCs induce TNF‐α secretion in recipient MCs. BMMCs or PCMCs were cultured in EV‐free medium in the presence or absence of LPS (100 ng/ml ) for an hour. A23187 (0.5 μM) and PBS were used as positive and negative controls, respectively. EVs were separated from the conditioned medium after 24 h. Naïve BMMCs (a) or PCMCs (c) were cultured in EV‐free medium (control) conditioned medium (SN), EV‐depleted conditioned medium (EV‐dep SN), EV‐reconstructed medium (EV‐rec SN) or separated EV containing non‐conditioned medium. For concentration measurements, different ratios of EV donor and acceptor cells were tested (b). Naïve BMMCs were also cultured in the presence of EVs from unstimulated BMMCs incubated in 100 ng/ml LPS for 2 h prior to experiments (d) or large‐, medium size‐ or small‐EVs of stimulated and unstimulated MCs (e). We used GW4869 (10 μM), a neutral sphingomyelinase inhibitor to block small EV generation, 30 min before LPS stimulation of donor cells. As GW4869 was diluted in DMSO, we used DMSO as control. Separated small particles were measured by NTA (f) and were added to naïve cells (same amount as producing cells) after washing for 24 h (g). In inhibition experiments, BMMCs were treated with TAK242 (0.2 μM), dynasore (80 μM) cytochalasin D (10μg/ml ) prior to culture in the presence of separated EVs from conditioned medium of unstimulated (PBS‐EV) or LPS‐stimulated (LPS‐EV) MCs (h). TNF‐α concentration was measured after 24 h with ELISA. Column bars are means of at least three independent experiments (biological replicates, n>3) as the mean and SD of three replicates (n = three, *P ≤ 0.05, **P ≤ 0.01, t test and ANOVA), where one dot indicates the average of three technical replicates. BMMCs were cultured for 24 h in EV‐free complete medium in the presence of isolated EVs derived from LPS‐stimulated (100 ng/ml ) and unstimulated BMMCs. Cells were washed two times lysed and investigated for phosphorylation of ERK1/2, JNK and P38 by RayBio Cell‐based phosphorylation ELISA kits (i). Biological replicates, n≥3, *P ≤ 0.05, **P ≤ 0.01, t test. Schematic picture shows the possible mechanism of MAPK signalling activation (j)
