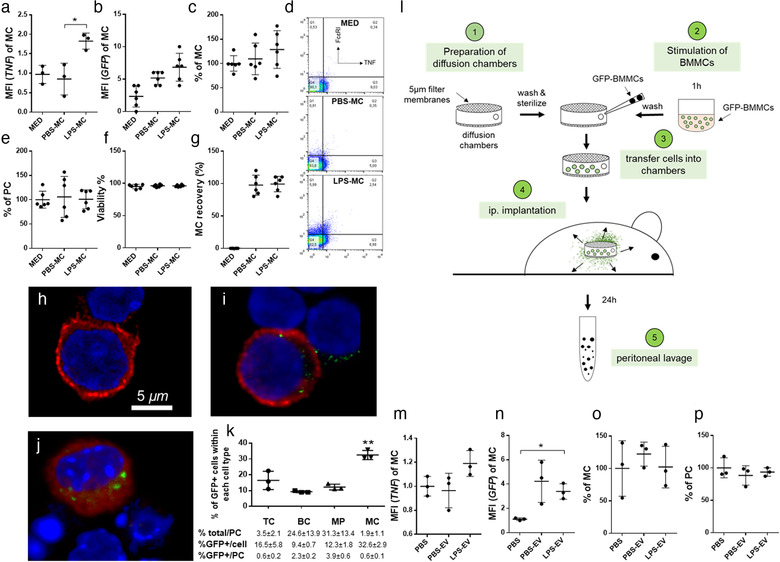
FIGURE 7.

LPS‐stimulated MCs release EVs which spread TNF‐α induction in MCs in vivo in the peritoneal cavity of mice. GFP‐BMMCs were incubated for 1h in the presence or absence of LPS (100 ng/ml ). EMD Millipore's Diffusion Chamber Kits were used with 5 μm pore size membrane filters. Empty (mock‐operated) and MC‐containing (100 ng/ml LPS‐stimulated or unstimulated) chambers were then implanted to the peritoneal cavities of C57BL/6 mice (a‐l). In additional experiments, EVs separated from the conditioned medium of LPS‐stimulated and unstimulated BMMCs were injected i.p. twice in 24 h (n‐p). After 24 h, mice were sacrificed and peritoneal cells were collected by peritoneal lavage. MC numbers (c, o) were determined using Kimura staining by light microscopy and by flow cytometry using the two pan‐MC markers CD117 (c‐Kit) and FcɛRI. Uptake of EVs by MCs was assessed by flow cytometry based on the GFP signal (b, n). Peritoneal cells (PC) were counted (e, p) and their viability (f) was assessed by trypan blue staining. Intracellular TNF‐α (a, m) was also measured by flow cytometry after Brefeldin A treatment (3 μg/ml for 1h). Representative plots of intracellular TNF staining in MCs are shown (d). Cells were examined under a confocal microscope upon staining for FcɛRI expression to identify MC and GFP signal to confirm EV uptake (h: med, i: PBS‐MC, j: LPS‐MC). Cells retrieved from the removed diffusion chambers were subjected to enumeration and viability tests using trypan blue staining (live cell recovery is shown in g). EV‐uptake by different cell types including T cells (TC), B cells (BC), macrophages (MP) and mast cells (MC) was determined as the % of GFP+ cells of each cell type (k). Frequency of different cell types among peritoneal cells (1st row), % of GFP+ cells of each cell type (2nd row) and % of GFP+ cells of a given cell type among all PCs (3rd row) are summarised in the table below figure k. Graphs show the mean and SD of at least 3 independent experiments (biological replicates, n ≥ 3, *P ≤ 0.05, **P ≤ 0.01, t test). Med: medium, MFI: mean fluorescence intensity
