
FIGURE 9.
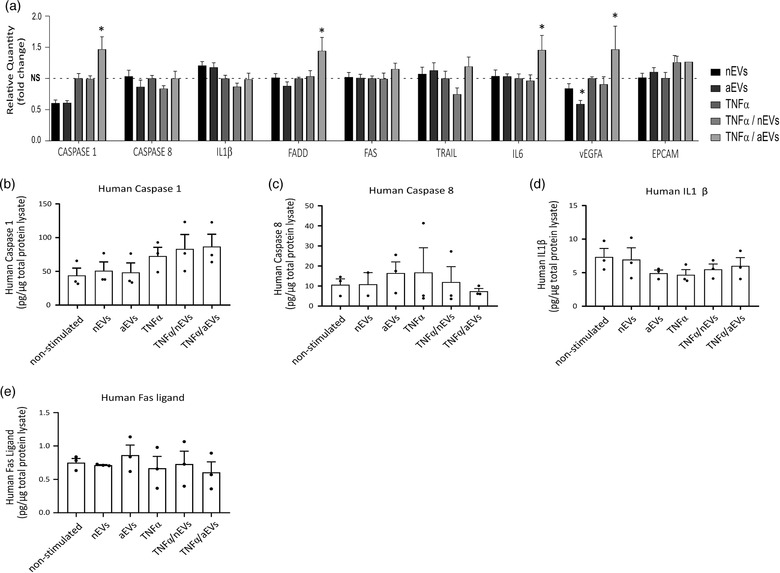
Quantification of key inflammatory and apoptotic markers that were not significantly upregulated in M‐EVs exposed cells. (a) Relative qPCR expression of candidate genes: caspase1, caspase8, IL1β, FADD, FAS, TRAIL, IL6, VEGFA and EPCAM in human microglia C20 cell lines stimulated with nEVs or aEVs either non‐activated or TNFα‐activated. Data were analysed using two stable reference genes and the fold changes were plotted as the mean ± SEM and normalized to non‐stimulated control cells (n = 3 biological replicates per group). (b‐e) ELISA analysis of apoptosis related markers: caspase 1, caspase 8, FAS and IL1β in microglia cell lysate stimulated with M‐EVs either non‐activated or TNFα‐activated. Values are represented as the mean ± SEM of three independent biological replicates. One‐way ANOVA Dunnett's multiple comparison test was used in GraphPad to determine statistical significance where P < 0.05 was considered as statistically significant