
FIG 6.
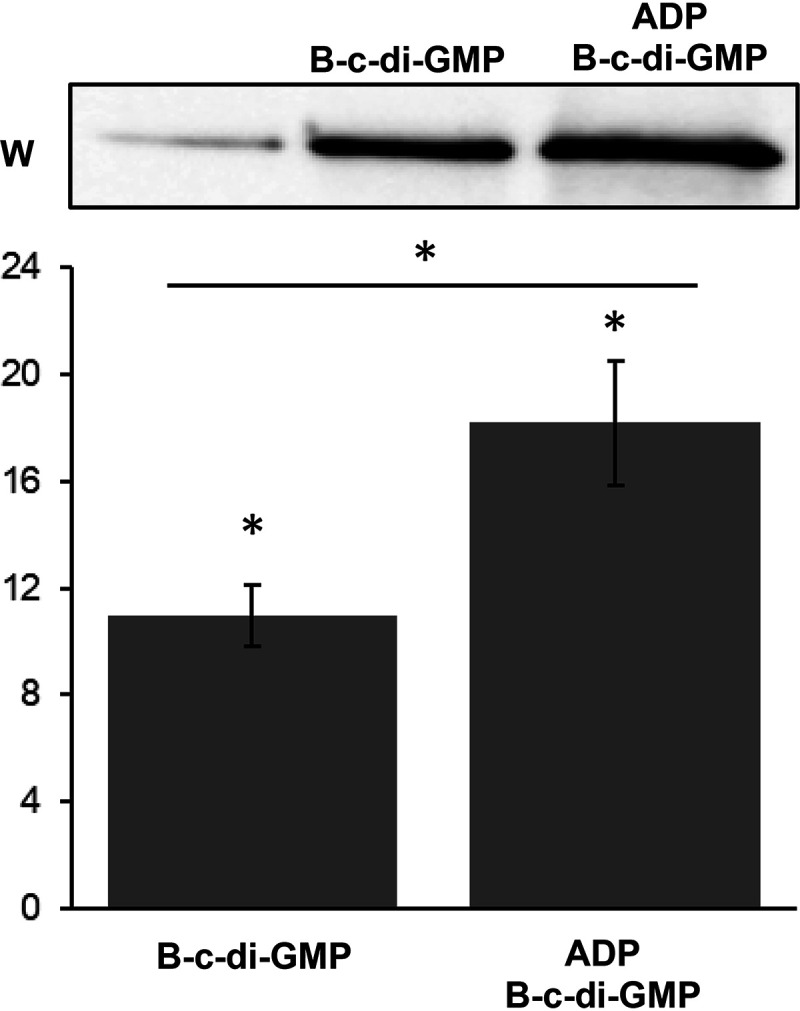
Pulldown of CckA using biotin-tagged c-di-GMP (B-c-di-GMP) shows that ADP weakly stimulates the binding of c-di-GMP. The vertical axis of the graph gives the fold change in band intensity relative to the band intensity of the negative control (beads and CckA alone), shown in the leftmost lane of the gel. Error bars indicate standard deviations (n = 6). Statistical differences (P < 0.05) indicated by asterisks were identified by by one-way ANOVA followed by Tukey’s honestly significant difference post hoc analysis.