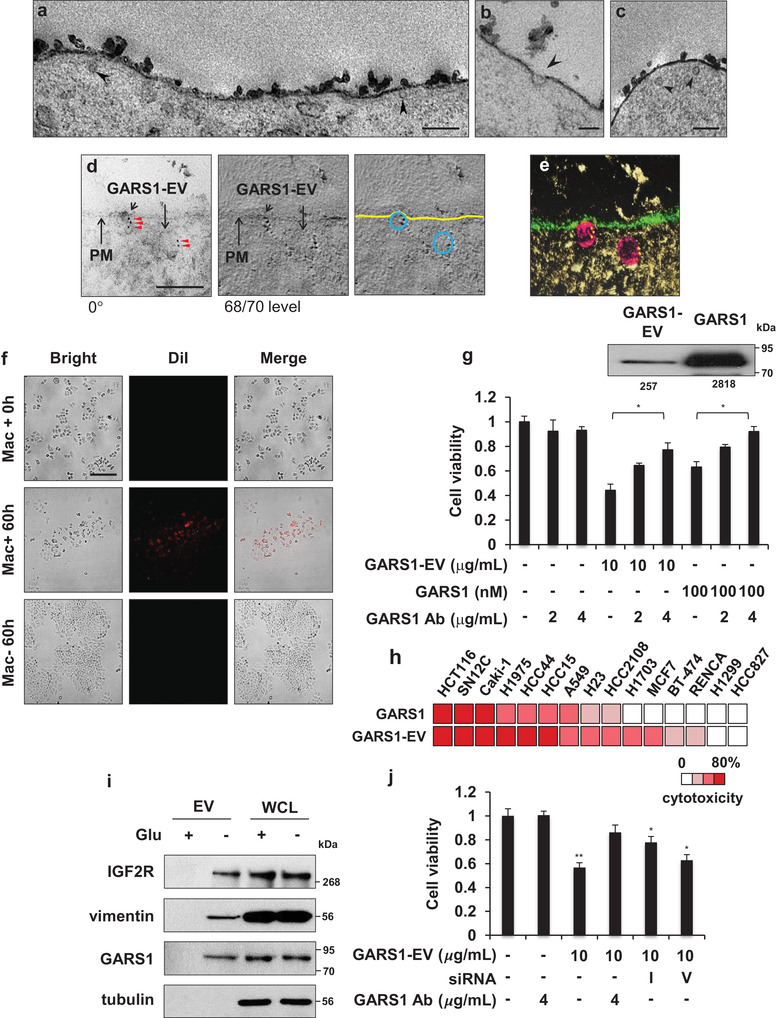
FIGURE 4.

Intracellular uptake and growth‐inhibiting effect of GARS1‐EVs on cancer cells. (a‐c) Electron microscopic images of H460 cell treated with GARS1‐EVs and chemically fixed after 10 min. The images show the plasma membrane with intracellular and extracellular regions and the arrowheads indicate GARS1‐EVs. (d) Images of immuno‐gold labelled GARS1‐EVs endocytosed by the cancer cells. GARS1‐EV‐treated H460 cells were cryo‐fixed and immunostained with the anti‐GARS1 antibody. For tomography, tilted images of the samples were recorded over an angular range from −60° to +60° with 2° increments. Numbers indicate the angle of the tilted sample (left). Tilted images were aligned and used to construct the tomogram. The number indicates the tomographic slice order (center). The plasma membrane (PM) and GARS1‐EVs are indicated in yellow and blue lines, respectively (right). (e) Electron tomography was reconstructed using the collected captured images and visualized using the composer and visualizer modules in TEMography and IMOD software. (f) DiI‐labeled RAW 264.7 and H460 cells were seeded in the upper and lower chambers of transwell (0.4 µm pore size), respectively. After 60 h of co‐culture, the macrophage‐derived DiI‐labeled GARS1‐EVs (red) and cancer cell confluency (bright field) were monitored in the lower chamber using fluorescence microscopy. (g) Cell viability was determined using the 3‐(4,5‐dimethylthiazol‐2‐yl)‐2,5‐diphenyl tetrazolium bromide (MTT) assay. The H460 cells were incubated with GARS1‐EVs (10 µg/ml) for 24 h. The purified his‐tagged GARS1 protein (100 nM) was used as a control. To neutralize the GARS1 effect, GARS1‐containing GARS1‐EVs and purified GARS1 were pre‐incubated with the anti‐GARS1 antibody for 30 min before addition to the H460 cell culture medium. Immunoblotting analysis was performed to evaluate the levels of GARS1 in the GARS1‐EVs and compared to naked GARS1 used for experiments. The protein band intensity was analysed using Image J (inset). (h) The comparative analysis of the apoptotic effects of GARS1‐EVs (10 µg/ml) and naked GARS1 (100 nM) on different cancer cells. (i) The presence of IGF2R and vimentin in the GARS1‐EVs was validated using immunoblotting. (j) RAW 246.7 cells were treated with siRNA to suppress the expression levels of IGF2R (I) and vimentin (V). The GARS1‐EVs were then isolated to examine the effect on cancer cell viability. The scale bars indicate 200 nm (a, c), 100 nm (b, d) and 50 µm (f). Data are presented as the mean ± standard deviation. *P < 0.01, **P < 0.001
