FIGURE 1.

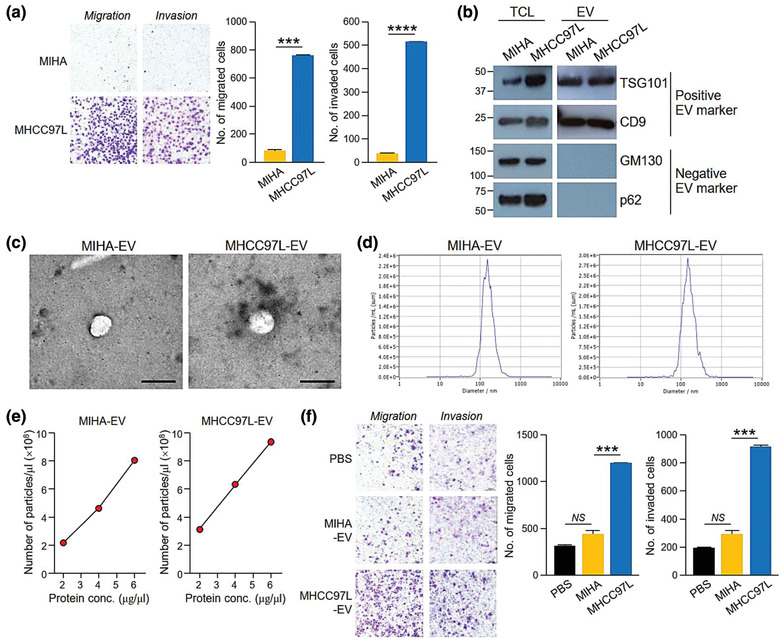
EVs of metastatic HCC cells displayed promoting effect in cell migration and invasion. (a) MIHA and MHCC97L were seeded at 4 × 10⁴ cells per well in triplicates for migration and invasion assays. After incubation, the migrated and invaded cells were fixed, stained and counted. Representative images of cells are shown. The number of cells is plotted. (b) Western blotting of EV molecular markers in 30 μg of total cell lysate (TCL) of MIHA and MHCC97L cells, and 15 μg of EVs derived from these 2 cell lines. Positive EV markers include TSG101 and CD9 while negative EV markers are cis‐Golgi marker GM130 and nucleoporin p62. (c) Representative electron micrographs of EVs collected from the conditioned medium of MIHA and MHCC97L cells evaluated are shown. Scale bar, 200 nm. (d) Size distribution of MIHA‐ and MHCC97L‐EVs were measured by nanoparticle tracking analyser. (e) Amount of EVs was determined in terms of number of particles and protein amount using nanoparticle tracking analyser and Bradford assay, respectively. Number of EVs per μl against protein concentration of EVs (μg/μl) is plotted. (f) Examination of the cell migration and invasiveness of PLC/PRF/5 cells pretreated with EVs collected from the conditioned medium of MIHA or MHCC97L cells. PLC/PRF/5 cells were seeded at 7 × 10⁴ cells per well in triplicates for the assays. Migrated and invaded cells were fixed, stained and counted. Representative images of cells are shown. The number of cells is plotted. Data are represented as mean ± SEM. * P < 0.05, ** P < 0.01, *** P < 0.001, NS, not significant. P < 0.05 is considered as statistically significant
