FIGURE 2.

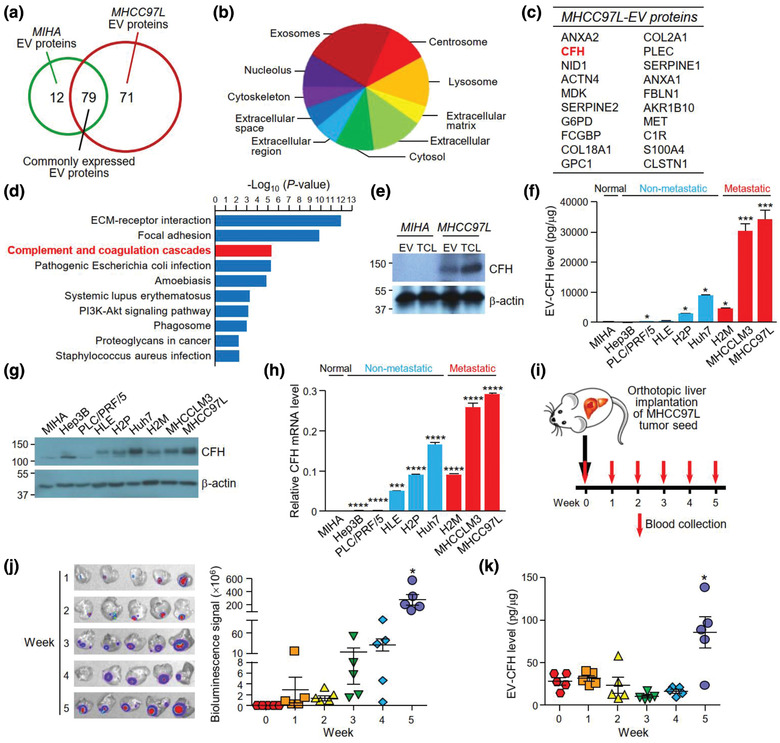
CFH is identified in EVs of metastatic HCC cells. (a) The Venn diagram illustrates the number of proteins expressed in either or both EVs of MIHA or MHCC97L cells. (b) Analysis of the distribution of cellular components of proteins detected in MHCC97L‐EVs using FunRich3.1.3. (c) Top 20 unique proteins identified in MHCC97L‐EVs are listed according to their expression intensity as detected by mass spectrometry. (d) Pathway analysis of proteins found in MHCC97L‐EVs using DAVID v6.8 pathway program. (e) Analysis of CFH expression in 30 μg of total cell lysate (TCL) and 15 μg of EVs of MIHA and MHCC97L cells by western blot analysis. (f) Analysis of CFH expression in EVs derived from various HCC cell lines by ELISA. Non‐metastatic and metastatic cell lines are indicated by blue and red colours, respectively. Protein (g) and mRNA (h) expressions of CFH were analysed by immunoblotting and quantitative PCR, respectively. The levels of EV‐CFH and CFH mRNA of HCC cell lines were statistically compared with that of MIHA cell line. (i) Blood was obtained from mice before and weekly after orthotopic liver implantation of luciferase‐labelled MHCC97L tumour seed (n = 5). EVs were isolated from the serum. (j) Ex vivo bioluminescence imaging of liver tissues. Quantification of the luminescence intensity is shown. (k) Analysis of CFH level in the circulating EVs (EV‐CFH) isolated from the serum of mice using ELISA. The bioluminescence signal and EV‐CFH level were statistically analysed with reference to week 0. Data are represented as the mean ± SEM; * P < 0.05. P < 0.05 is considered as statistically significant
