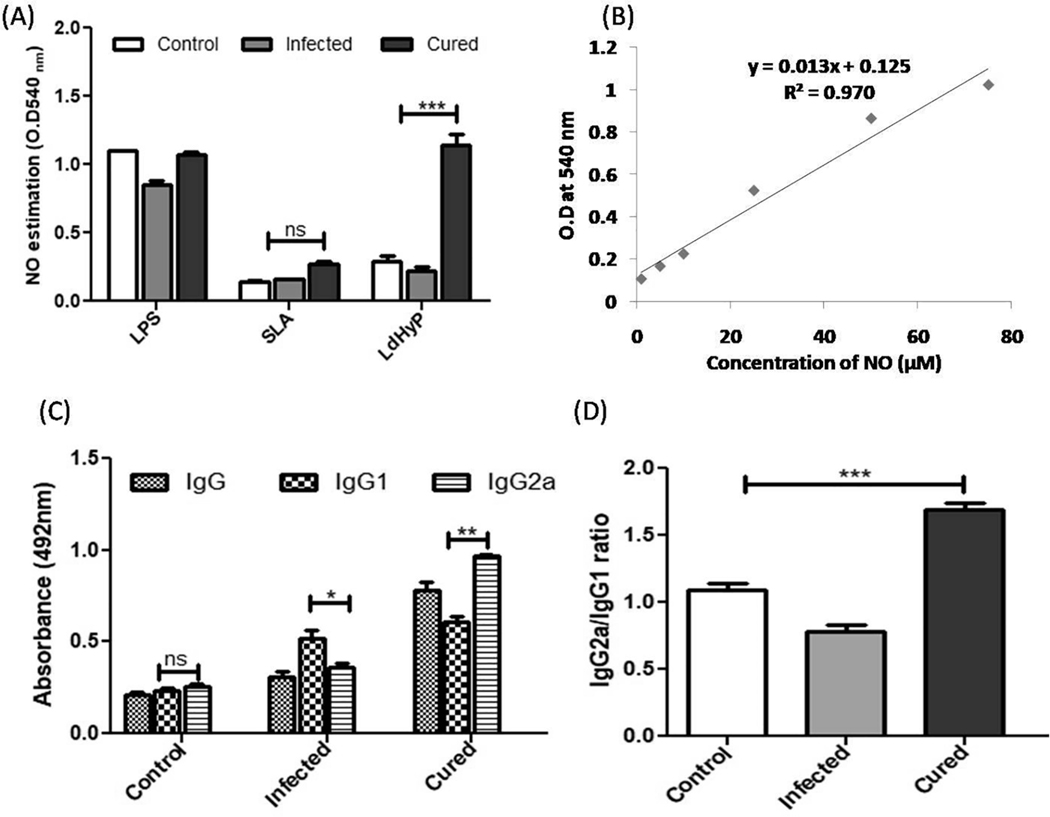
Fig. 6.
In vitro cellular and humoral immune response induced by LdHyP in vaccinated challenged mice. (A) Estimation of NO production in supernatant collected from 72 hr stimulated splenocytes of all three experimental groups of mice with LPS/SLA and LdHyP. 1:1 ratio of both supernatant and Griess reagent was used and takes reaction product absorbance at 540 nm. (B) Standard graph was generated by sodium nitrite (NaNO2). (C) LdHyP specific IgG and its isotype IgG1 and IgG2a in the sera of cured mice followed by infected mice. (D) The IgG2a versus IgG1 ratio in the sera of all experimental groups of mice. Data represent the mean ± SD of two independent experiments in triplicate. *p < 0.05, **p < 0.01, ***p < 0.001, ns: no significant.

