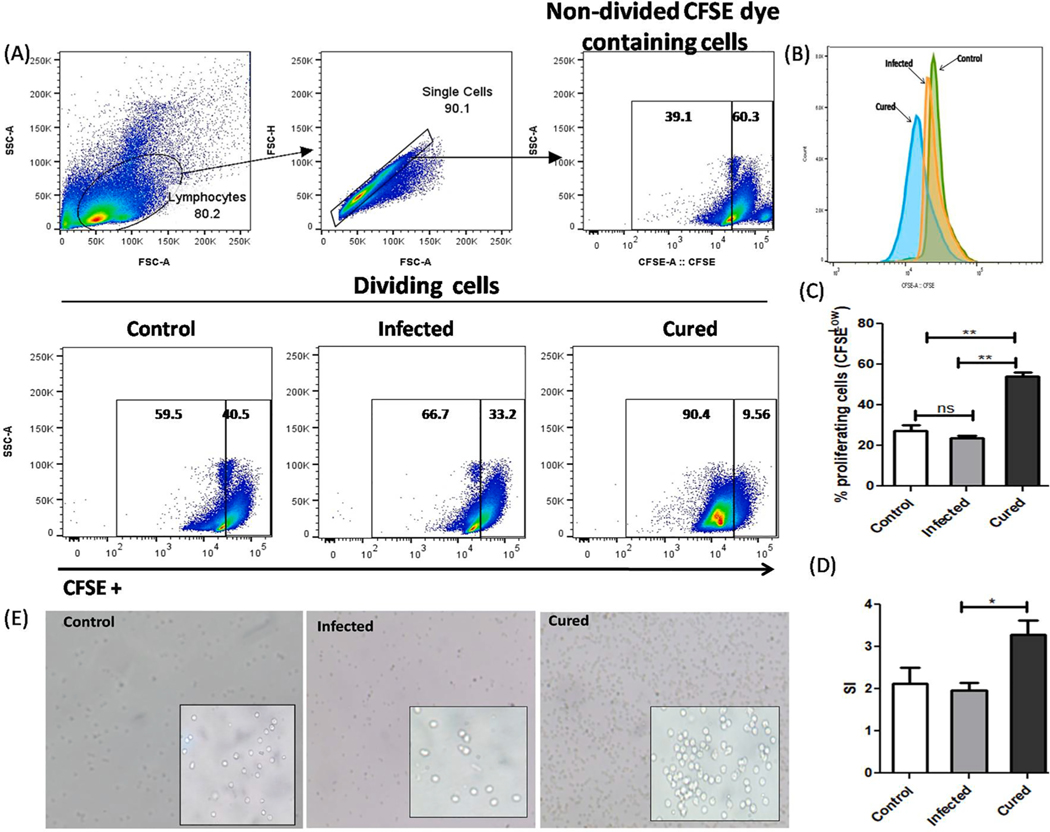
Fig. 7.
LdHyP specific splenocytes cell proliferation in cured mice followed by control and infected mice. (A) Single cell suspension of spleen (5×10⁶) from all three experimental groups of mice were labeled with CFSE dye and stimulated for 3 days as mentioned in material and methods section for cell proliferation by FACS. (B) Histogram of CFSE labeled proliferating cell (CFSE low) in all three groups. (C) Percentage of splenocytes cells proliferation (CFSE low) and stimulation index of LdHyP (D) in all three groups. (E) Microscopic evaluation of cell proliferation in all three groups of mice under 10X magnification (inset 40X magnification). Data represent the mean ± SD of two independent experiments. *p < 0.05, **p < 0.01, ns: no significant.

