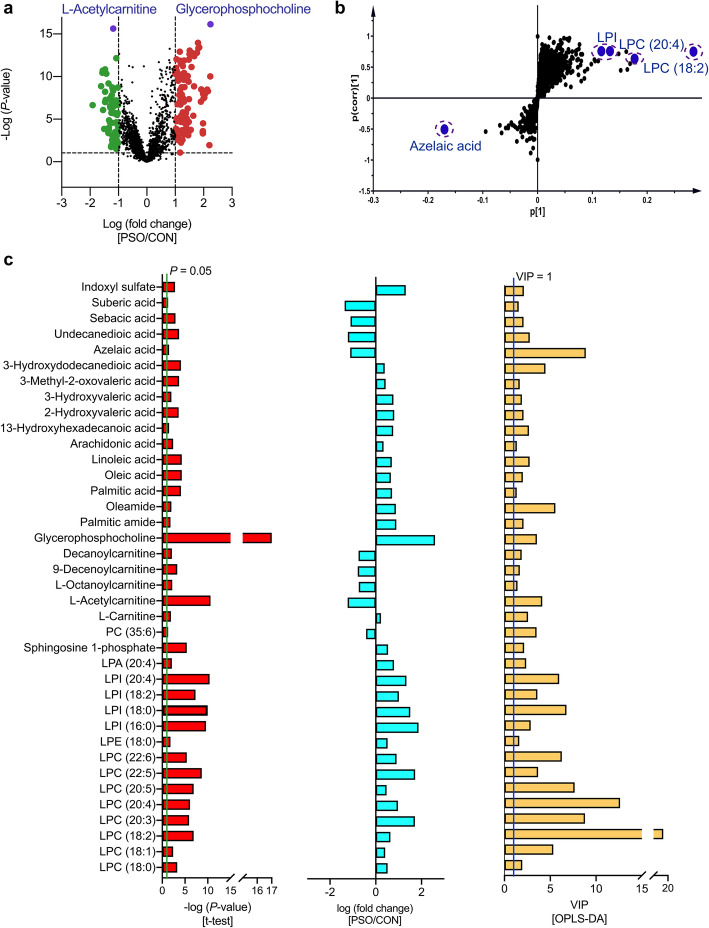
Fig. 2.
Screening criteria for the differential metabolites identified in the PSO/CON comparison in study cohort 1. a. Volcano plot showing the variations in metabolites in the PSO/CON comparison according to the -log(P-value). b. S-plots for covariance and reliability correlations from OPLS-DA in the PSO/CON comparison. c. Thirty-seven identified differential metabolites in the PSO/CON comparison. The Bar plots represent, from left to right, the −log(P-value) outcomes from the t-test, the fold changes and the VIP values obtained from OPLS-DA. CON: group of healthy controls; PSO: group of psoriasis patients

