Fig. 4.

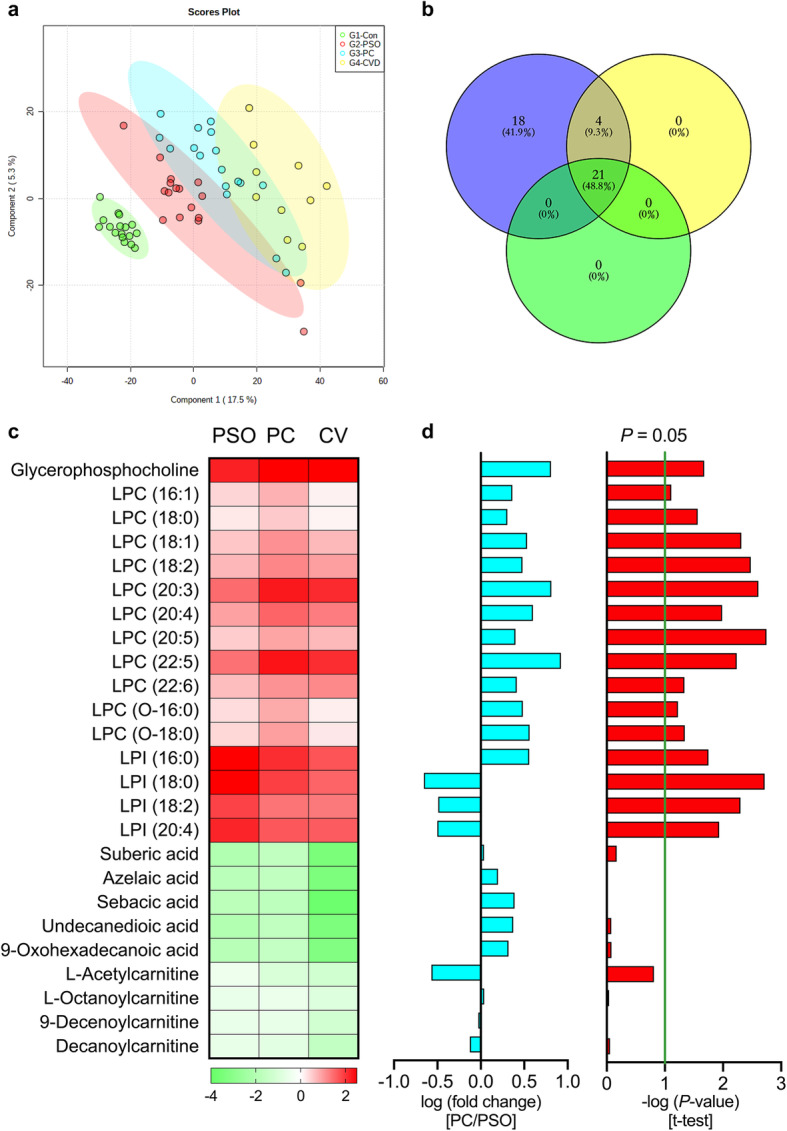
Common and specific metabolites in psoriasis patients with or without coronary heart disease. a. sPLS-DA score plots of the CON, PSO, PC and CV groups in study cohort 2. The CON group is indicated with green circles, the PSO group with red circles, the PC group with blue circles, and the CV group with yellow circles. b. Venn diagram of the 25 overlapping metabolites in the PSO, CV and PC groups compared with the CON group in study cohort 2. c. Heatmap of the 25 overlapping metabolites in the PSO, PC and CV groups (all compared with the CON group). d. The bar plots represent, from left to right, the log (fold change value) and -log(P-value) from t-test analysis in the PC/PSO comparison in study cohort 2. CON: group of healthy controls; PSO: group of psoriasis patients; PC: group of psoriasis patients with coronary heart disease; CV: group of coronary heart disease patients without psoriasis
