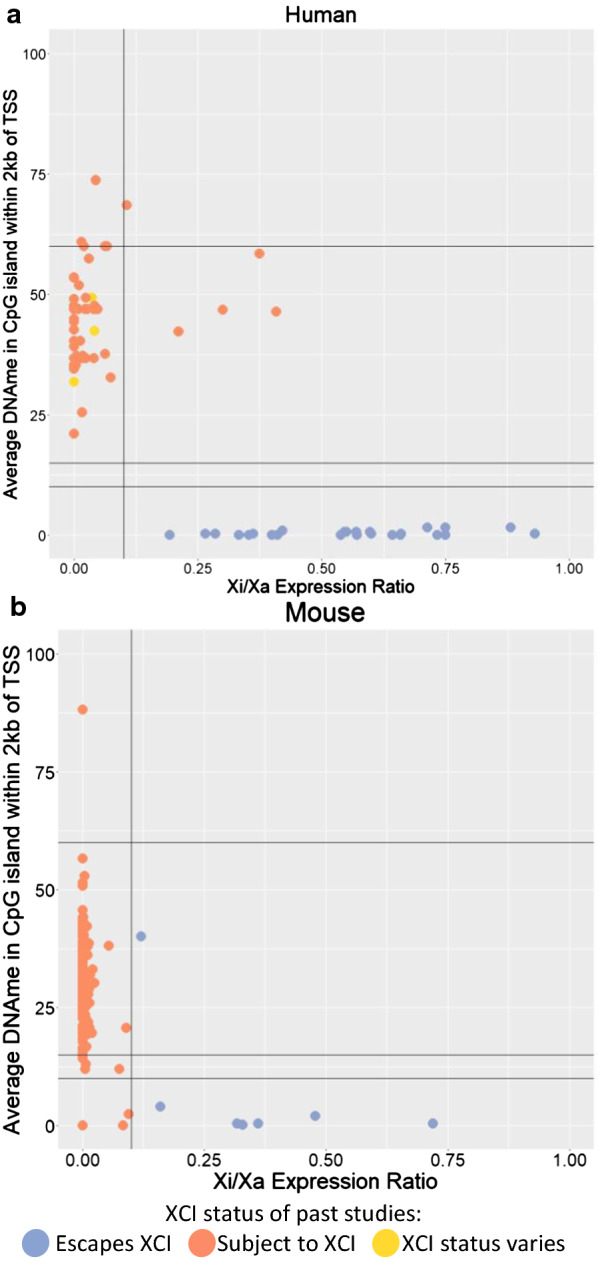
Fig. 1.

Using Xi/Xa expression ratio to establish thresholds of DNAme for XCI status calls. Two species are featured: human (a) and mouse (b). Each point is a SNP with Xi/Xa expression data, matched to the closest CpG island within 2 kb of the closest TSS (accounting for which splice variants would include the SNP) in order to have matched DNAme values. Lines are drawn at 0.1 Xi/Xa expression and at 10, 15 and 60% DNAme as they were used as thresholds to call XCI escape status subsequently. Points are colored based on their XCI status calls. For human, previously published XCI status calls were used [15], while in mouse, which did not have studies calling genes as subject to XCI, they were colored based on their Xi/Xa expression-based XCI status calls featured here. Genes in the pseudoautosomal region, which matches to the Y chromosome, were filtered out. CEMT30, a leukemia cancer sample was used for A, while the Keown et al. data were used for B
