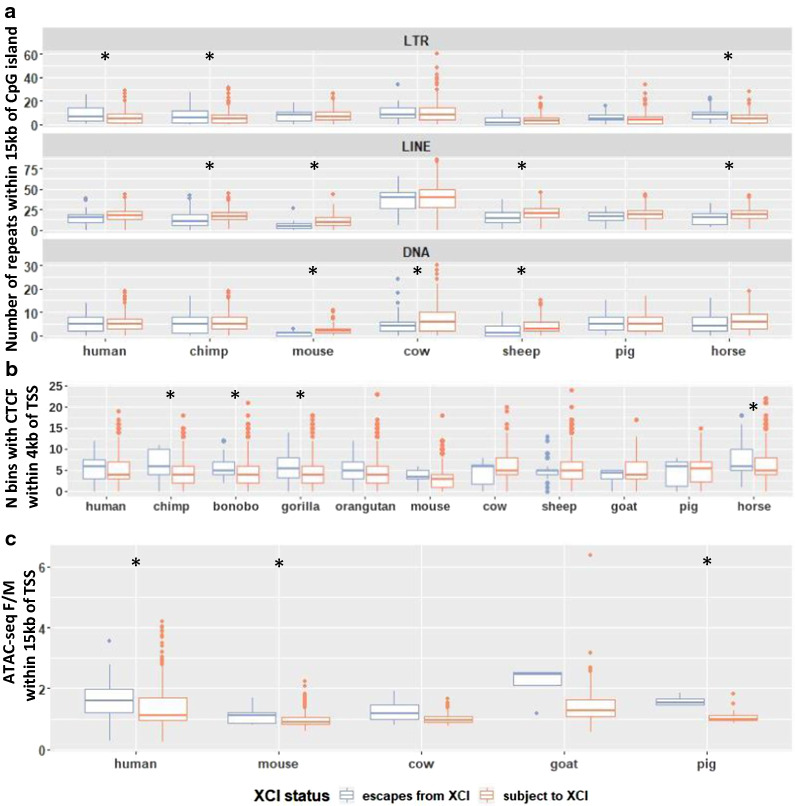
Fig. 6.
Enrichment of elements which may be related to XCI status. a The number of repetitive elements of each class within 15 kb of each CpG island, sorted by XCI status. See Figure S7 for the repeat classes not shown here. b CTCF binding in overlapping 200-bp bins was predicted using a DanQ model [40]. The Y axis shows the number of bins with > 50% predicted probability of having CTCF binding within 4 kb of each TSS. c Female/male ATAC-seq signal averaged across samples within 250 bp of each TSS. F/M is female over male. Species with a * have significant differences between genes escaping XCI and those subject to XCI (t-test, adjusted p-value < 0.01). P-values are listed in Additional file 5: Table S4, along with the number of CpG islands or TSSs per XCI status in each species used for each analysis

