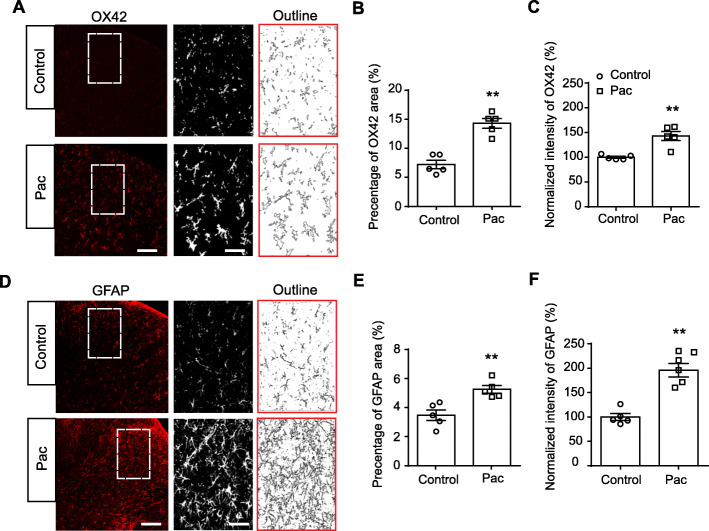
Fig. 2.
Overexpression of OX42 and GFAP in SCDH of paclitaxel-treated rats. a Representative immunofluorescence images indicating OX42 (a microglia marker) antibody staining of spinal cord from control and paclitaxel-treated (Pac) groups. Areas staining positive for ATF3 are shown in red. Each dorsal horn was outlined for further analysis. Microglia were further magnified in SCDH and outlines of microglia were illustrated in the right panel. Scale bars indicates 100 μm (entire spinal dorsal horn) and 25 μm (magnified dorsal horn), respectively. b Percentage of OX42 positively staining area in each observation field. c Summary of the normalized % increase in fluorescence intensity of OX42 immunostaining in each observation field. The value of each group was normalized to that of control group. d Representative immunofluorescence images indicating GFAP (an astrocyte marker) antibody staining of spinal cord from control and Pac groups. Areas staining positive for GFAP are shown in red. Astrocytes were further magnified and outlines of astrocytes were illustrated in the right panel. Scale bars indicates 100 μm (entire spinal dorsal horn) and 25 μm (magnified dorsal horn), respectively. e Percentage of GFAP positively staining area in each observation field. f Summary of the normalized % increase in fluorescence intensity of GFAP immunostaining in each observation field. The value of each group was normalized to that of control group. n = 5 rats/group. **p < 0.01 vs. control group. Student’s t test was used for statistical analysis in panels (b, c, e, and f)

