Fig. 3.
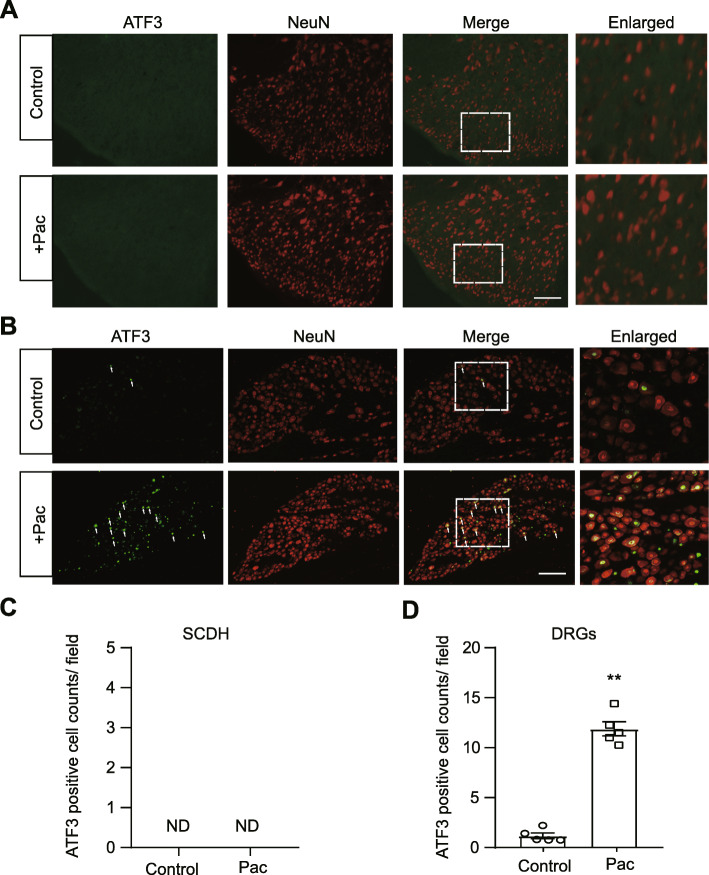
Neuronal damage examination of SCDH and DRGs of paclitaxel-treated rats. a b Representative immunofluorescence images indicating ATF3 antibody staining of SCDH (a) and DRGs (b) from control and paclitaxel-treated (Pac) groups. Areas staining positive for ATF3 are shown in green. NeuN (red) was used for neuron labeling. c, d Summary of ATF3 positively stained neurons per observation field in SCDH (c) and DRGs (d) from control and paclitaxel-treated groups. ND: not detectable. **p < 0.01 vs. control group. n = 5 rats/group. Student’s t test was used for statistical analysis

