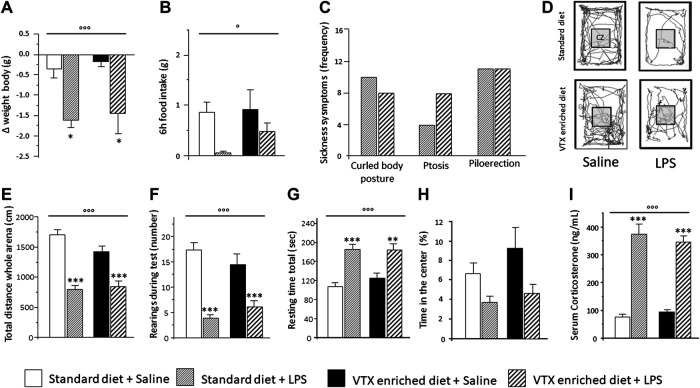
FIGURE 2.
Six hours after LPS injection, the physiological and behavioral effects related to the sickness did not differ between mice that received standard diet as compared to mice that received VTX-enriched diet before the immune challenge. Histograms (A–C) represent (A) the variation in body weight and (B) food intake and (C) the frequency of symptoms of sickness behavior in LPS-injected animals previously fed with standard diet or VTX-enriched diet. (D) Representative movement traces of all groups in the open field. CZ, central zone. Histograms (E–H) represent the behaviors in the open field test; (E) total distance moved (cm) in the entire open field area; (F) number of rearings during test; (G) resting time during test; (H) percentange of time spent in the center of the open field. (I) Serum corticosterone levels of animals that did not perform behavioral tests (cohort 2) 6 h after the immune challenge. Treatment as indicated in the legend, n = 12 mice per group except for the evaluation of frequency of symptoms of sickness behavior n = 18 per group. Data are represented as means ± SEM and were analyzed with ANOVA followed by Tukey’s HSD (two-way ANOVA: ◦ p < 0.05, ◦◦◦ p < 0.001 main effect LPS/saline; post hoc: *p < 0.05, **p < 0.01, ***p < 0.001, indicating a significant difference compared to saline-treated matching group).

