
FIGURE 6.
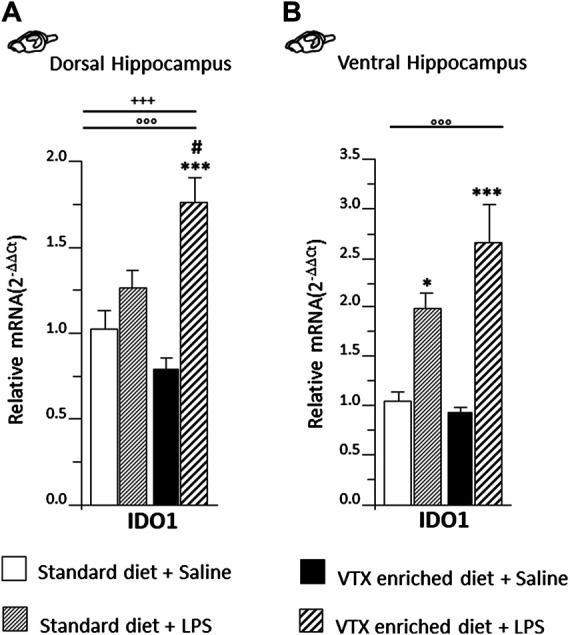
LPS injection strongly induced IDO1 expression only in the dorsal hippocampus of animals that received chronic treatment with VTX, while in the ventral hippocampus, IDO was significantly higher in LPS-treated mice regardless of treatment. Gene expression results are shown as fold changes relative to saline-treated control (standard diet) group. Bar graphs representing the expression of IDO1 in the (A) dorsal hippocampus or in the (B) ventral hippocampus. Treatment as indicated in the legend, n = 9–10 mice per group. Data are represented as means ± SEM and were analyzed with ANOVA followed by Tukey’s HSD (two-way ANOVA: ◦◦◦ p < 0.001 main effect LPS/saline; +++ p < 0.001 LPS/saline* standard/VTX-enriched diet interaction; post hoc *p < 0.05, ***p < 0.001 indicate significant difference compared to saline-treated matching group; # p < 0.05 indicates significant difference compared to matching control group).