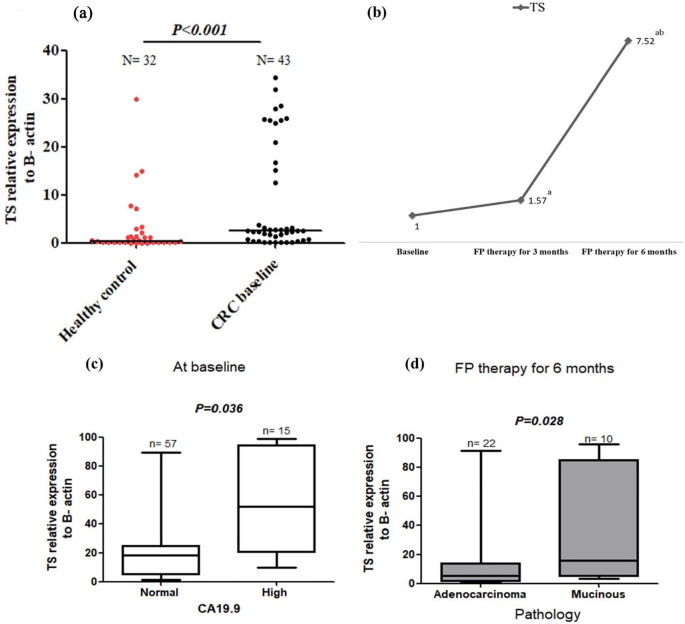
Figure 2.
TS expression in healthy control and baseline CRC patients (a), the change in TS expression after 3 and 6 months of FP therapy normalised to their baseline levels (b), TS expression at low and high CA19.9 subgroups of baseline CRC patients (c) and TS expression in adenocarcinoma and mucinous pathological subtypes of tumours after 6 months of FP therapy (d).
aIs a significant difference when CRC patients after 3 and 6 months of FP therapy were compared with their baseline level, P value ⩽.05.
bIs a significant difference when CRC patients after 6 months of FP therapy were compared with their level after 3 months of FP therapy, P value ⩽.05. Total RNA was extracted from the isolated lymphocytic cell pellets of healthy control and CRC patients at baseline and after 3 and 6 months of FP therapy. RNA was converted into cDNA, and then RT-PCR amplification was conducted with the designed TS gene sequence.

