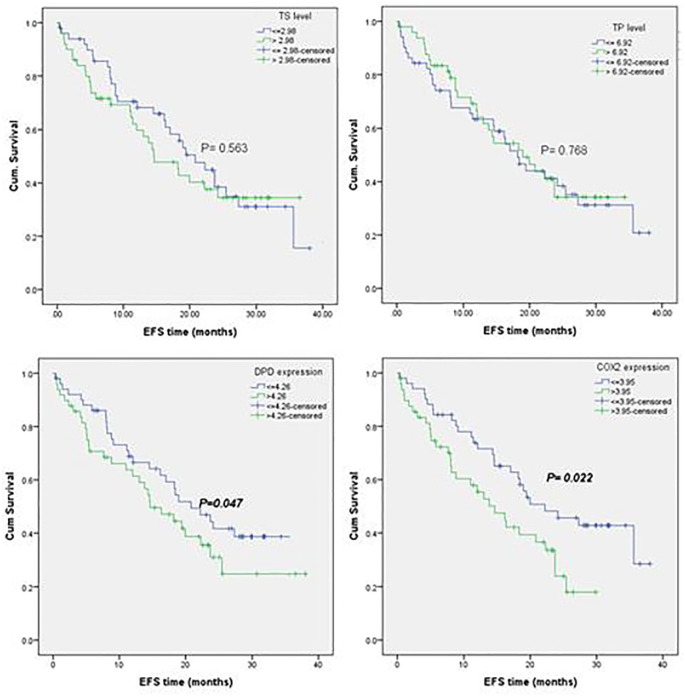
Figure 6.
Kaplan-Meier EFS curves for molecular subgroups of CRC patients. TS ⩽ 2.98 and TS > 2.98 (a), TP ⩽ 6.92 and TP > 6.92 (b), DPD ⩽ 4.26 and DPD > 4.26 (c) and COX2 ⩽ 3.95 and COX2 > 3.95 (d).
The baseline median relative expression of TS, TP, DPD and COX2 genes normalised to β-actin for 43 CRC patients were 2.98, 6.92, 4.26 and 3.95, respectively. Patients were stratified around the medians calculated for the 4 genes’ baseline expression levels, and then the time to recurrence or progression was calculated with Kaplan-Meier test of survival.

