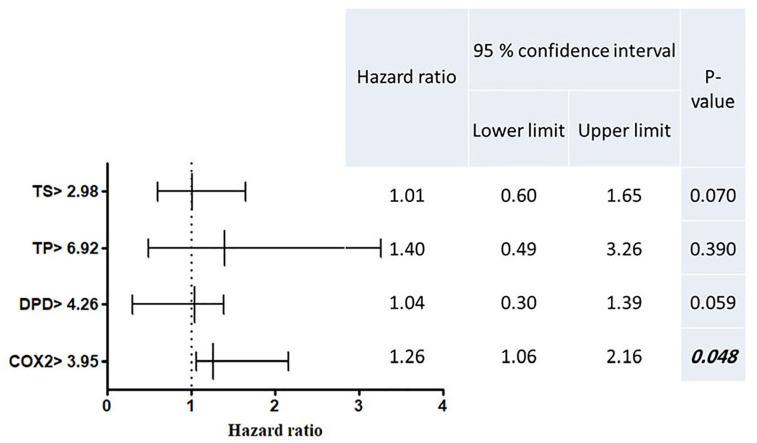
Figure 7.
Multivariate COX regression model for the hazard ratio of recurrence or progression and its 95% confidence interval for molecular subgroups of CRC patients.
Significant P-value ⩽.05 marked bold italic font, and indicates significant hazard of recurrence or progression during the EFS time. Patients were stratified around the medians calculated for the 4 genes’ baseline expression levels, where the baseline median expression of TS, TP, DPD and COX2 genes were 2.98, 6.92, 4.26 and 3.95, respectively. Then the hazard ratio of table variables (genes expression > baseline median level), were compared with the hazard ratio of reference variables (genes expression ⩽ the baseline median level which equal 1), by multivariate COX regression test of survival.

