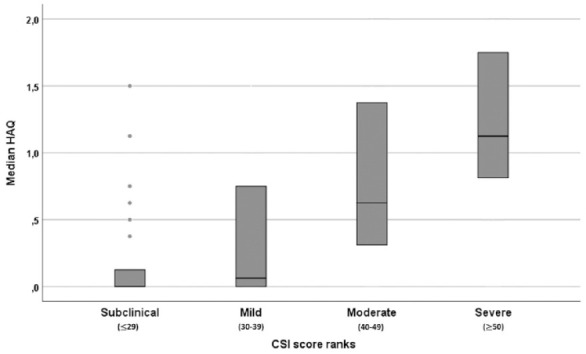
Figure 1.

Distribution of the HAQ-DI score according to the different CSI score ranks of the overall cohort. Bars show median and interquartile range.
CSI, central sensitization inventory; HAQ-DI, Health Assessment Questionnaire Disability Index.

Distribution of the HAQ-DI score according to the different CSI score ranks of the overall cohort. Bars show median and interquartile range.
CSI, central sensitization inventory; HAQ-DI, Health Assessment Questionnaire Disability Index.