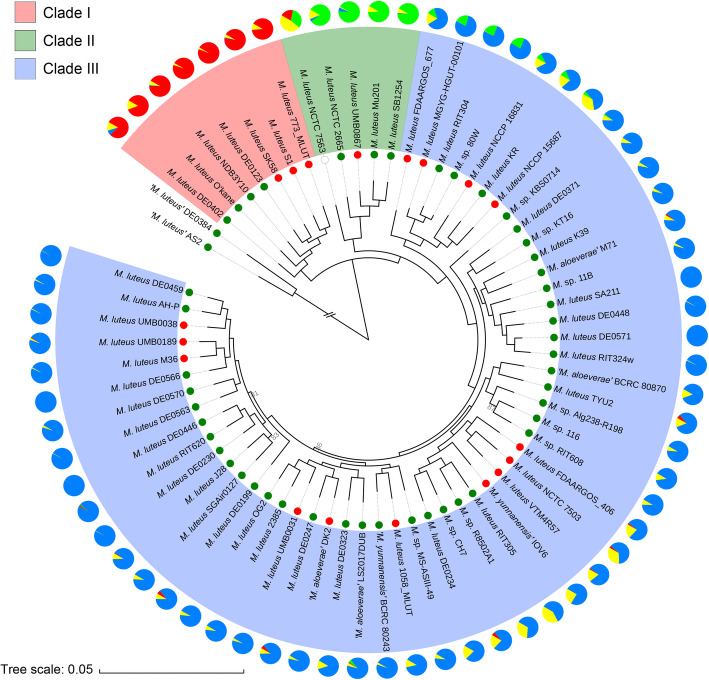
Fig. 3.
Phylogenetic tree and the population structure of the M. luteus strains. Maximum-likelihood phylogeny was generated from concatenated 922 single-copy core genes of 68 strains, including the two outgroup strains. Three major clades were presented by different background colors. All nodes have at least 90% bootstrap support, except where indicated. Different habitats are represented by inner circles in different colors (red, HA; green, NHA; blank, uncertain). The output from Structure analysis was indicated in the pie charts with colors indicating the proportion of ancestry estimated from each of four hypothetical ancestral populations (red, POP1; green, POP2; blue, POP3; yellow, POP4). The scale bar indicates 5% sequence divergence

