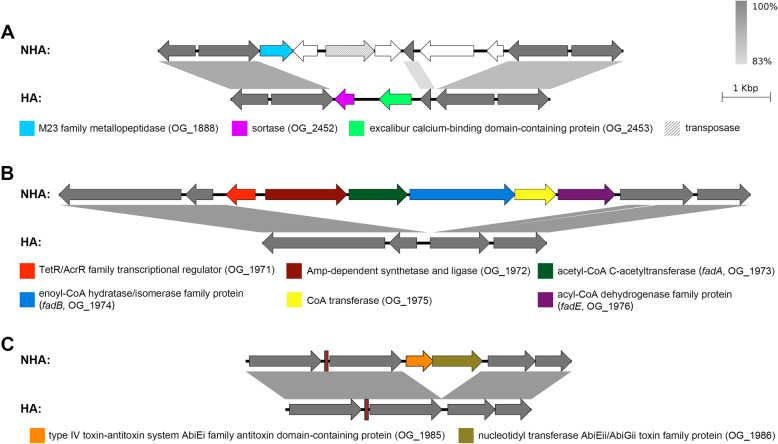
Fig. 6.
Genetic organizations of the regions containing habitat-associated genes. Details of these genes are shown in Table S2. The figure was obtained by EasyFig, where gray-scale bars represent regions of shared similarity according to BLASTn. Colored arrows indicate habitat-associated genes. Grey arrows indicate flanking and unrelated genes. a The versatile genomic region with both HA and NHA genes. Slash indicates transposase gene. Blank arrows indicate habitat unassociated genes. b The gene cluster for degradation and recycling of fatty acids via β-oxidation. c The gene cluster for bacterial abortive infection system. Slim rectangle indicates tRNA gene

