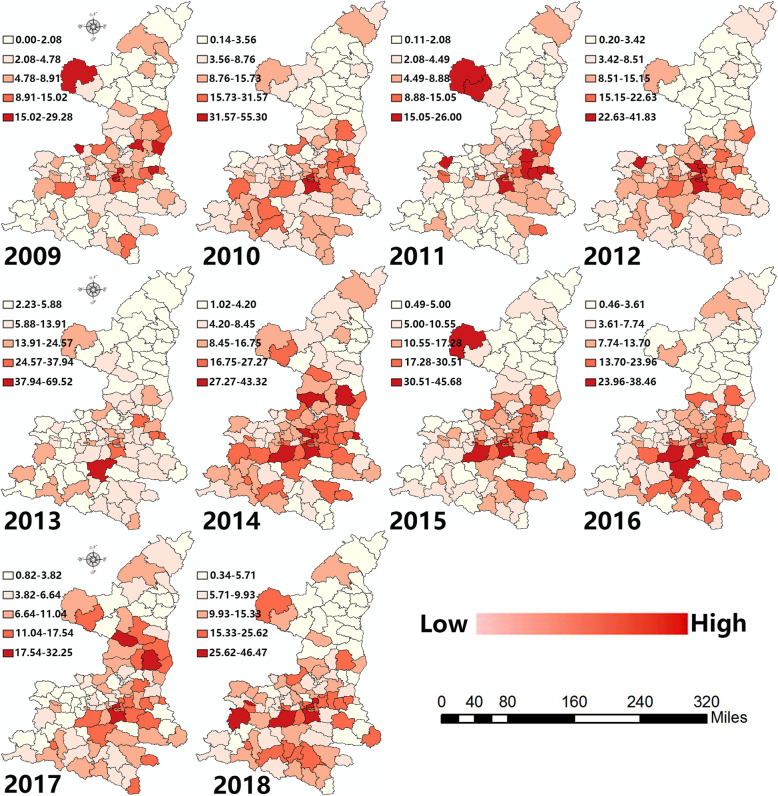
Fig. 3.
Map showing the hierarchy of the incidence rates for HFMD (made through GeoDa and ArcGIS, source of shape files: http://www.geodata.gov.cn/web/geo/index.html, under license without need for permission). *This figure was made by ourselves through GeoDa (Version 1.8.61, the University of Chicago, Chicago, IL, USA) and ArcGIS (Version 10.0, ESRI Inc., Redlands, CA, USA). The source of shape files was a public database, National Nature Resources and Geospatial basic information database of PRC (http://www.geodata.gov.cn/web/geo/index. html). Those shape files were under license without need for permission

