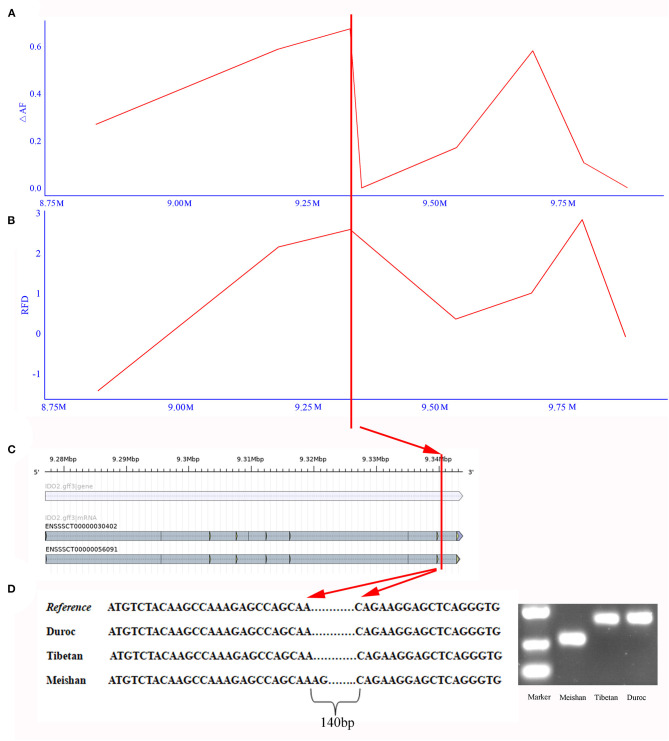
Figure 4.
Detected deletion in IDO2 gene. (A) The ΔAF values of deletions around IDO2 gene. X-axis means the region around the IDO2 gene in chromosome 17. Y-axis indicates ΔAF value. (B) The RFD values of deletions around IDO2 gene. Y-axis indicates the RFD value. (C) The gene structure of IDO2 gene. The horizontal blue bar represents the gene region, and the horizontal gray bar indicates transcript. (D) Deletions in IDO2 gene of Meishan pig. The left chart indicates the sequence of different breeds in the deleted region. The right chart shows PCR results to detect this deletion in Meishan, Tibetan wild boar, and Duroc breeds.

