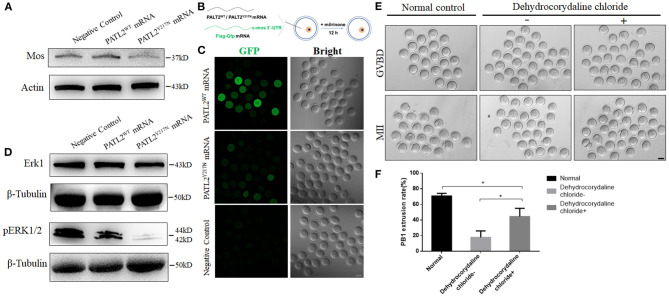
Figure 5.
Repression of MOS with its cascade effect and phenotypic rescue by dehydrocorydaline chloride. (A) The MOS level in oocyte groups of negative control, PATL2WT or PATL2Y217N cRNA microinjected were determined by western blot. (B) Illustration of mRNA microinjection and oocyte culture. (C) Fluorescence results showing the expression of GFP fused with Mos 3′-UTR. The scale bar represents 50 μm. (D) ERK1and pERK1/2 protein levels in in oocytes of negative control, PATL2WT or PATL2Y217N cRNA microinjected were determined by western blot. (E) Representative images of normal control oocytes and that of PATL2Y217N cRNA injected oocytes were cultured with/without dehydrocorydaline chloride. Scale bars indicate 50 μm. (F) Quantitative analysis of Pb1 extrusion rate. Data are represented as the mean ± SD; *p < 0.05.

