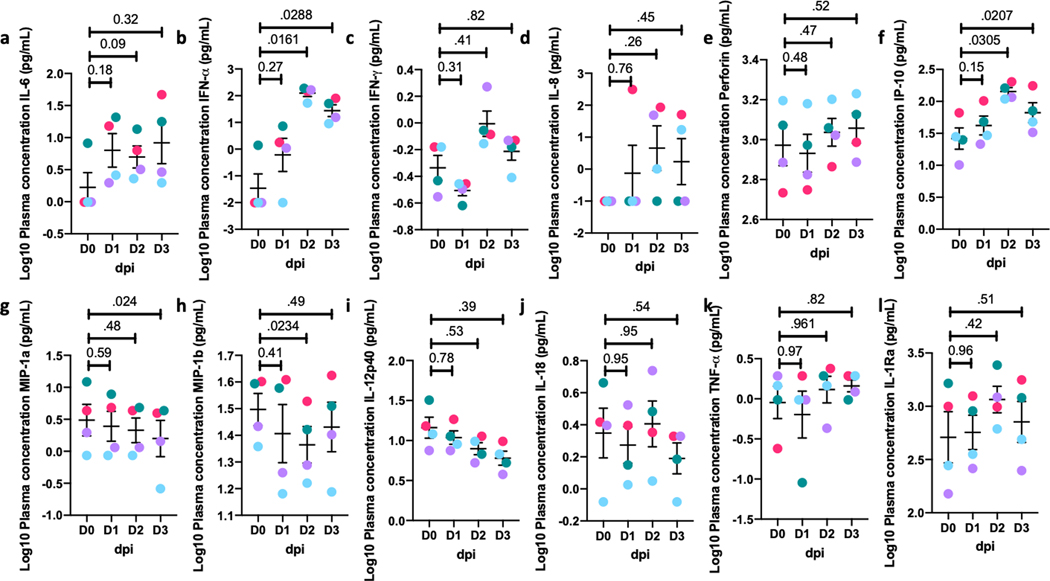
Extended Data Fig. 8. SARS-CoV-2 induced cytokines in plasma.
Simultaneous analysis of multiple cytokines by Luminex technology in the plasma of rhesus macaques over 0–3 dpi. Levels of IL-6 (a), IFN-a (b), IFN-g (c), IL-8 (d), perforin (e), IP-10 (f), MIP1a (g), MIP1b (h), IL-12p40 (i), IL-18 (j), TNF-a (k) and IL-1Ra (l)are expressed in Log10 concentration in picogram per mL of plasma for rhesus macaques over 0–3 dpi (Circles, Colors represent individual animals, Supplementary Table 1). (n=4) Data are represented as mean± SEM. One way repeated-measures ANOVA with Geisser-Greenhouse correction for sphericity and Tukey’s post hoc correction for multiple-testing (GraphPad Prism 8) was applied.

