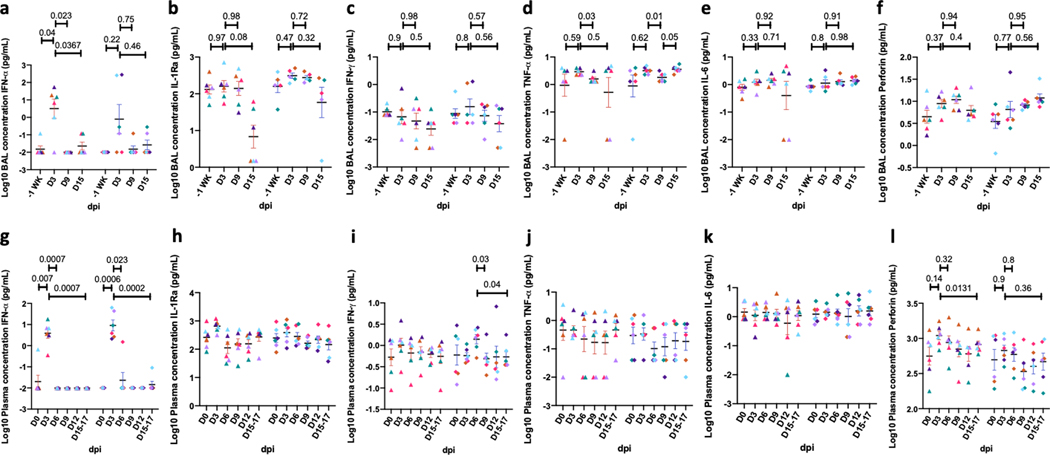
Extended Data Fig. 10. Longitudinal changes in SARS-CoV-2 induced cytokines in BAL fluid and plasma following SARS-CoV-2 infection in rhesus macaques over two weeks.
Simultaneous analysis of multiple cytokines by Luminex technology in the BAL fluid and plasma of rhesus macaques over 0–15 dpi. Levels of IFN-a (a), IL-1Ra (b), IFN-g (c), TNF-a (d), IL-6 (e), Perforin (f) are expressed in Log10 concentration in picogram per mL of BAL fluid. Levels of IFN-a (g), IL-1Ra (h), IFN-g (i), TNF-a (j), IL-6 (k), Perforin (l) are expressed in Log10 concentration in picogram per mL of BAL fluid. Coloring scheme – young (blue), old (red). Data are represented as mean± SEM. (n=12) Two way Repeated-measures ANOVA with Geisser-Greenhouse correction for sphericity and Tukey’s post hoc correction for multiple-testing (GraphPad Prism 8) was applied. (Rhesus macaques: Old-Triangle, Young Diamonds, Colors represent individual animals, Supplementary Table 1).

