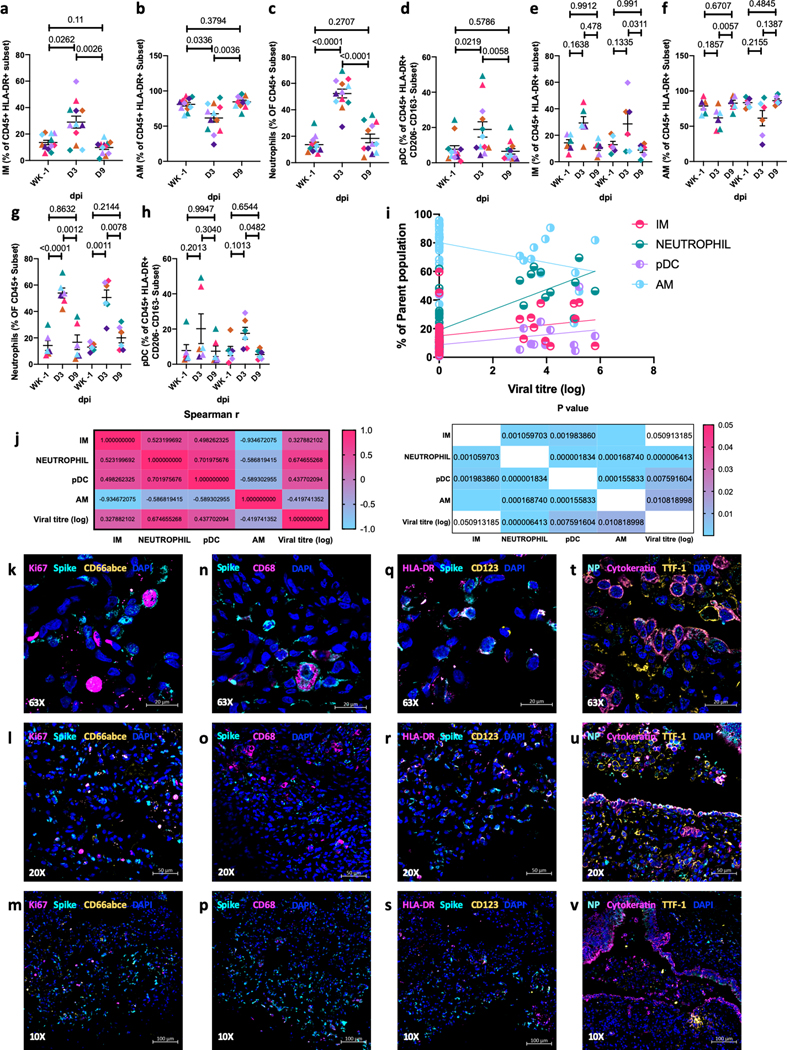
Figure 4. Accumulation of myeloid cells in BAL of infected rhesus macaques.
Flow cytometric analysis of BAL IMs (a, e), AMs (b, f), neutrophils (c,g), and pDCs (d, h). Data shown combined for age (a-d) (n=12); data split by age (g-h) (n=6). Data is represented as mean± SEM. (a-d) One way and 36 two way Repeated-measures ANOVA with Geisser-Greenhouse correction for sphericity and Tukey’s post hoc correction for multiple-testing (GraphPad Prism 8) was applied. (Old-Triangle, Young Diamonds, Colors represent individual animals, Supplementary Table 1). (n=12). Correlations with Spearman’s rank test between cellular fraction and Log10 viral RNA copy number in BAL (i) and corresponding values for Spearman’s rank correlation coefficient (j, left panel) and P values (j, right panel). Coloring scheme for i – Neutrophil (teal), IM (magenta), AM (turquoise, pDC (light purple). Multilabel confocal immunofluorescence microscopy of FFPE lung sections from SARS CoV-2 infected Rhesus macaques having a high viral titer at 3 dpi with DAPI (blue) (k-v) and SARS CoV-2 Spike (k-s) specific antibody (turquoise), k-m: KI-67 (magenta) 37, neutrophil marker CD66abce (yellow); n-p: SARS CoV-2 Spike (turquoise), pan-macrophage marker CD68 (magenta) and DAPI (blue); q-s: SARS CoV-2 Spike (turquoise), HLA-DR (magenta), pDC marker CD123 (yellow) and DAPI (blue); t-v: SARS CoV-2 Nucleocapsid protein specific antibody (turquoise), Pan-cytokeratin (magenta), Thyroid transcription factor-1 (yellow) at 63X (k,n,q,t), 20X (l,o,r,u) and 10X (m,p,s,v).

