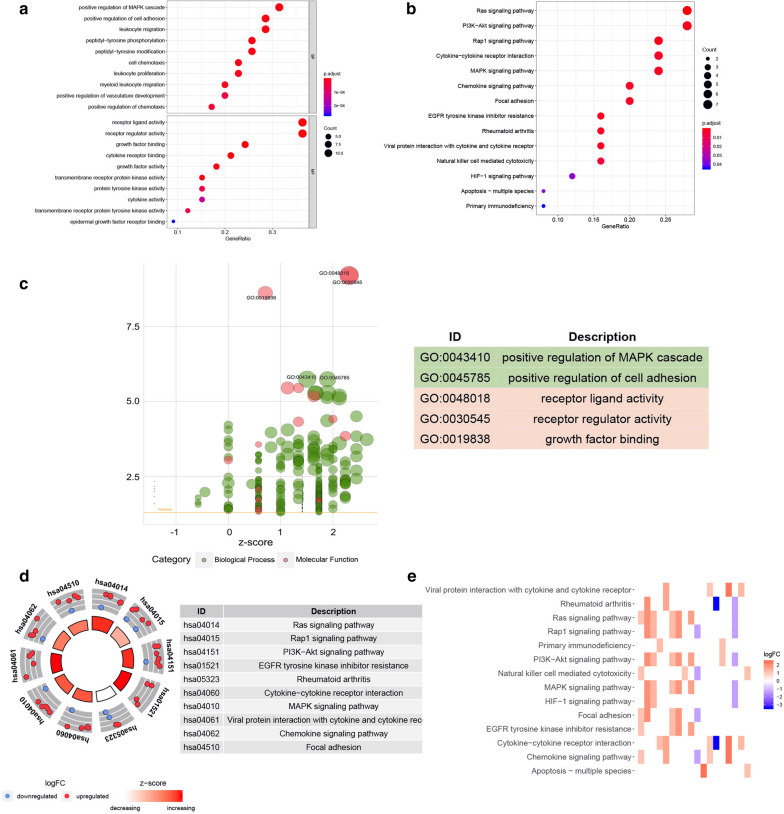
Fig. 2.
Functional annotation of prognosis-related immune genes. a Performed GO analysis on immune genes related to prognosis. b KEGG pathway analysis of immune genes related to prognosis. c The x-axis represented the z-score, the y-axis represented the negative logarithm of the P-value, and the size of the circle was proportional to the number of genes. Green circles correspond to the biological process and red indicated the molecular function. d The outer circle showed a scatter plot for each term of the logFC of the assigned genes. Red displayed increase, and blue displayed decrease. e The heatmap showed the correlation between prognostic immune genes and pathways

