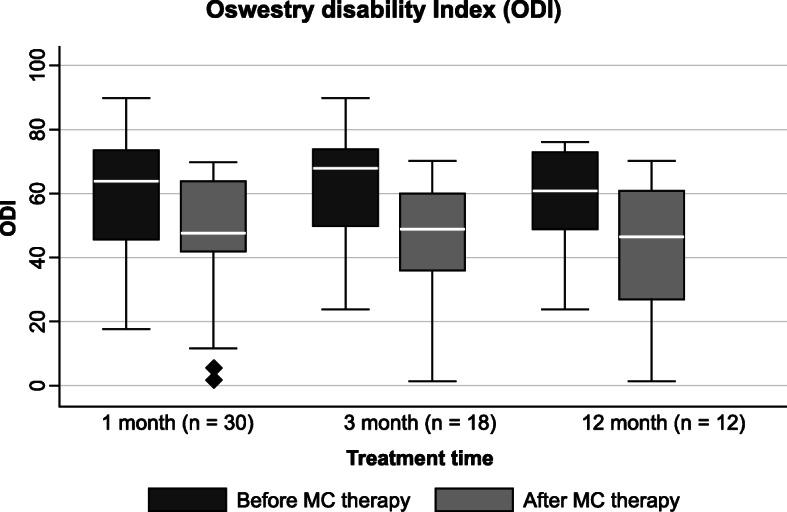
Fig. 4.

Oswestry Disability Index at 1, 3, and 12 months. ODI boxplots before and after MC therapy at 1, 3, and 12 months. Statistically significant improvements were registered for comparisons at 1, 3, and 12 months (P < 0.01). The boxes contain the middle 50% of the values; the thick white lines indicate the median; the whiskers connected by dashed lines to the boxes mark the minimum and maximum values except when there are outliners, which are specifically indicated by circles. ODI Oswestry Disability Index, MC medical cannabis
