Fig. 2.
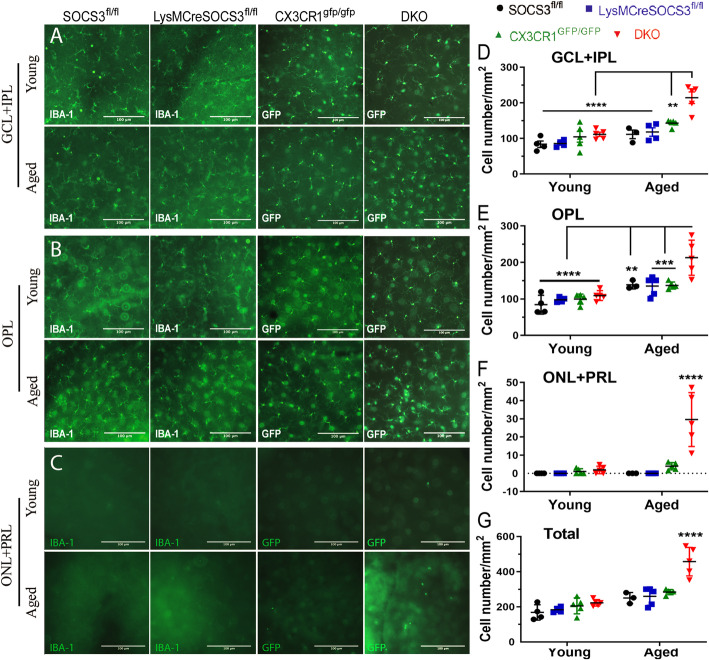
Retinal microglia in different groups of mice. Retinal flatmounts from young (3–5 months) and aged (10–12 months) Socs3fl/fl and LysMCre-Socs3fl/fl mice were stained for IBA-1. Retinal flatmounts from Cx3cr1gfp/gfp and DKO of the same age remain unstained. All samples were imaged by Dmi8 fluorescence microscopy. a-c Representative images of retinal microglia from GCL + IPL (a), OPL (b) and ONL + PRL (c). d-f quantification of microglia in different retinal layers of different mice. (g) The total number microglia in all retinal layers. Mean ± SD, N = 3 ~ 5 mice, Scale bar: 100 μm. Two-way ANOVA, Tukey’s test, ** P < 0.01, *** P < 0.001, **** P < 0.0001 (**** showed the difference between aged DKO and other groups in f and g). GCL – ganglion cell layer; IPL – inner plexiform layer; OPL – outer plexiform layer; ONL – outer nuclear layer; PRL – photoreceptor inner/outer segment layer

