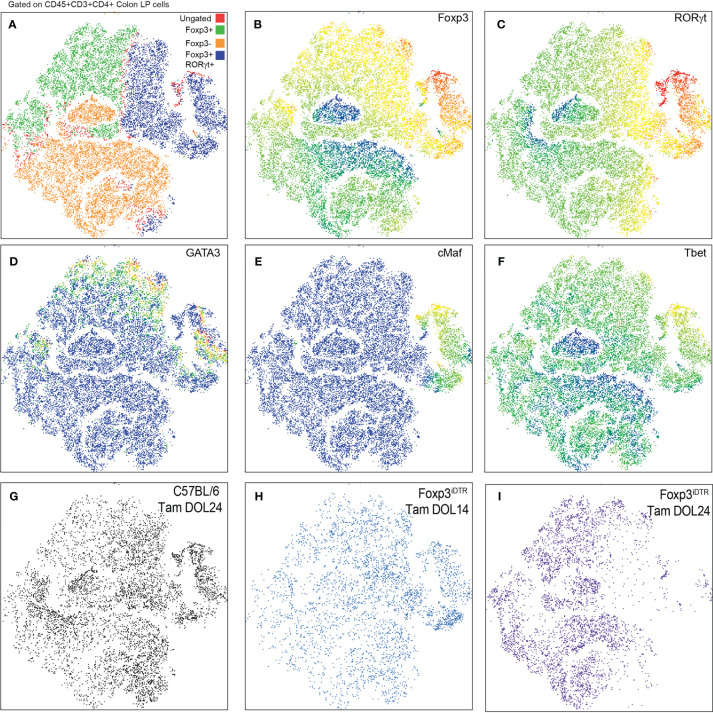
Figure 3.
RORγt+FoxP3+ peri-weaning Tregs include a heterogeneous population of Tregs that express GATA3, cMAF, and Tbet. (A) viSNE plots of colon CD4 T cell populations from pooled samples denoting Foxp3+ and RORγt+Foxp3+ and Foxp3− clusters. (B–F) Plots also show individual expression of Foxp3, RORt, GATA3, cMAF, and Tbet. (G–I) Plots of CD4+ T cells in the colon LP from individual experimental conditions. Vsne analysis in (A–F) are pooled from n = 3 mice per group, plots in (G–I) are representative of n = 3 mice per group.

