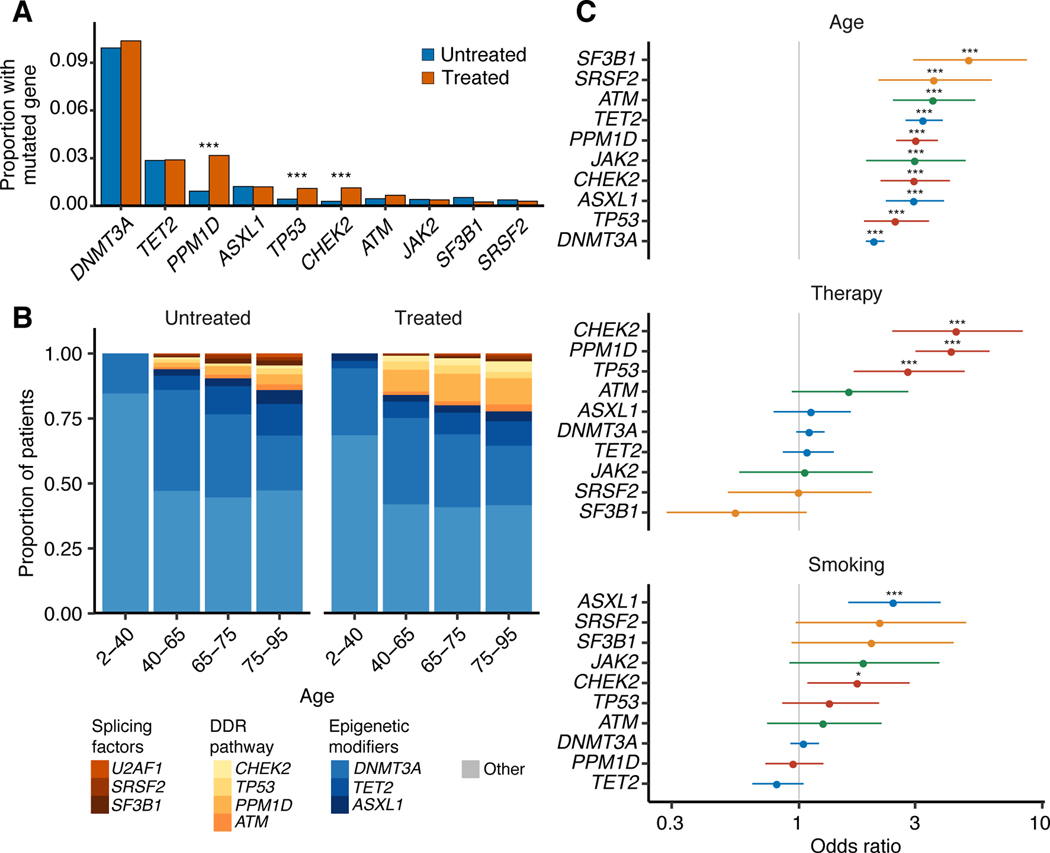
Figure 1. Specific molecular subtypes of CH-PD correlate with age, prior therapy exposure and smoking history.
(A) Proportion of patients with CH-PD mutations in specific genes among treated and untreated patients. Multivariable logistic regression was used to test whether the odds of having a specific gene mutated differed between treated (n=5,978) and untreated (n=4,160) patients after adjustment for age, gender, smoking and ethnicity. * p<0.05, ** p<0.01, *** p<0.001 (B) Among patients with CH-PD, the proportion with mutations in specific genes, by age group and treatment status. (C) Odds ratio with 95% confidence interval for CH-PD mutation in the ten most commonly mutated genes with top, increasing age (n=10,138); middle, for patients previously exposed to cancer therapy (n=5,978) compared to those with no exposure (n=4160); bottom, for current/former smokers (n=4,989) compared to non-smokers (n=5,145) in multivariable logistic regression models adjusted for therapy, smoking, ethnicity, age, gender and time from diagnosis to blood draw. *, q-value (FDR-corrected p-value) <0.05, ** q<0.01, *** q<0.001. Age is expressed as the mean centered values.

