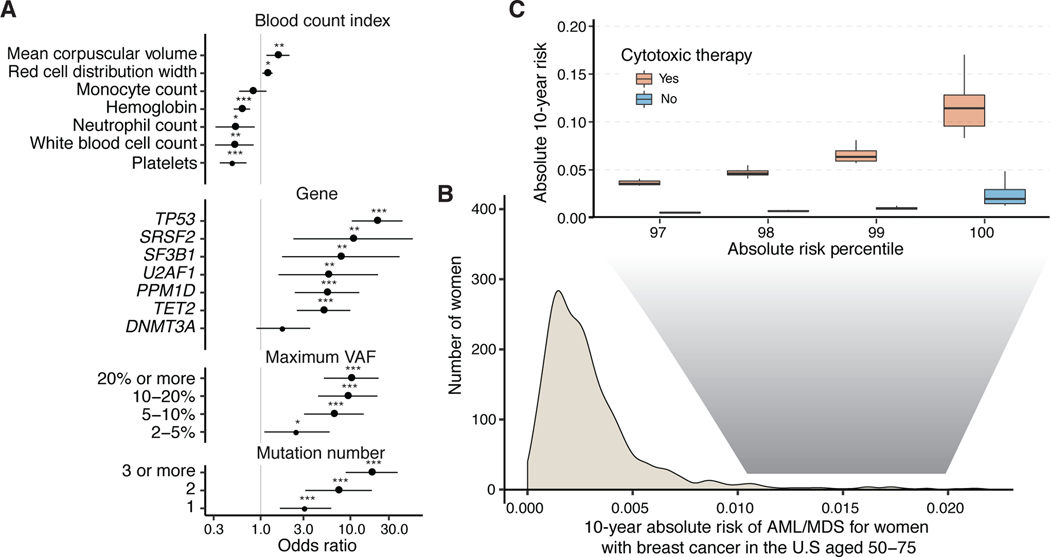
Figure 4. Risk of AML or MDS by clinical and CH-PD mutational characteristics in patients with solid tumors.
(A) Hazard ratio and 95% confidence intervals from Cox regression for blood count indexes, and CH-PD mutational characteristics for therapy-related myeloid neoplasms (tMN; AML or MDS, n=75). All models were adjusted for age and gender and stratified by study center. Blood counts are expressed as the mean centered score (the OR is per 1 SD of the blood count). * p<0.05, ** p<0.01, *** p<0.001. (B) Projected distribution of absolute 10-year risk of AML or MDS for women after a breast cancer diagnosis in the United States aged 50–75 at presentation based on our synthetic model. (C) Comparison of distribution of absolute 10-year risk of AML or MDS among women at the top percentiles of risk between those who go on to receive adjuvant cytotoxic chemotherapy and those who receive surgery only. n=9,437.

