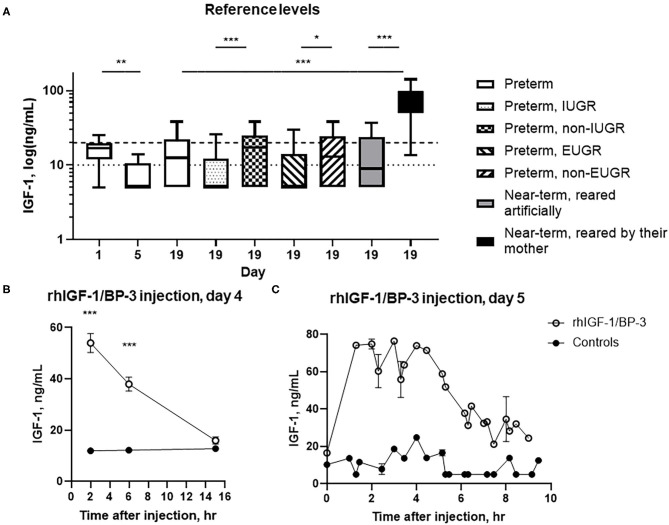
Figure 2.
Circulating IGF-1 levels and pharmacokinetics (mean ± SEM). (A) Basal IGF-1 plasma levels in 1–19 day-old preterm pigs reared in incubators (n = 7–107), near-term pigs reared in incubators (n = 14), and near-term pigs reared with their mother (n = 12). The 19 day-old preterm pigs were subdivided into pigs with intrauterine growth restriction (IUGR, n = 28) or non-IUGR (n = 79), and extrauterine growth restriction (EUGR, n = 26) or non-EUGR (n = 80), with growth restriction defined as the pigs with body weight within the lowest 25% of the growth percentiles. Data are presented as box plots (median and 25/75 percentiles) with whiskers = min to max. The interrupted horizontal line indicates the lower limit of quantitation (20 ng/ml) and the dotted horizontal line indicates the limit of detection (10 ng/ml) of the assay. (B) Serum IGF-1 levels in rhIGF-1/BP-3 and control preterm pigs after a single subcutaneous injection of rhIGF-1/BP-3 or vehicle on day 4 (n = 18–23) (mean ± SEM). (C) Serum IGF-1 levels at euthanasia 0–10 h after the last subcutaneous injections of rhIGF-1/BP-3 or vehicle on day 5 (n = 1–2 for samples taken 1-10 h after last dosing). t = 0 represents samples taken 15 h after last dosing (n = 16–19). *p < 0.05, **p < 0.01, ***p < 0.001.

