Fig. 1.
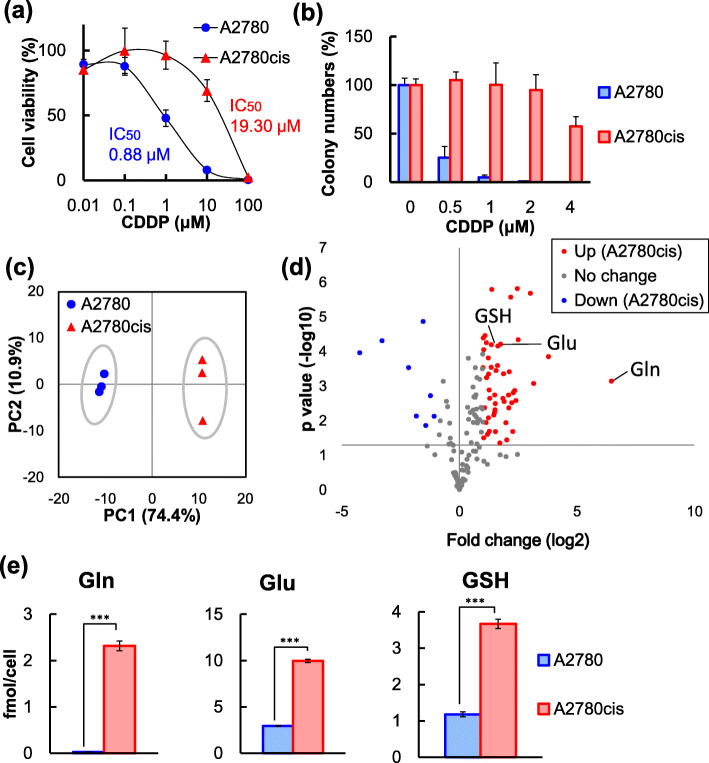
Increase in CDDP resistance and global metabolic changes in A2780cis cells. a Effects of CDDP treatment on the viability of A2780 and A2780cis cells. Cell viability was measured at 48 h after treatment using the MTT assay. b For colony formation assays, A2780 and A2780cis cells were cultured in the presence of CDDP (concentrations as indicated). Colonies were counted 9 days after plating. c Score plots of principal component analysis (PCA) of 189 intracellular metabolite levels in A2780 and A2780cis cells measured using CE-TOFMS. The contribution rate of PC1 and PC2 were 74.4 and 10.9%, respectively. d Volcano plots with the fold change of each metabolite and p values calculated using the Student’s t-test (p < 0.05). The averages metabolite levels in A2780cis cells were compared with those in A2780 cells (n = 3). Red dots depict significantly increased metabolites in A2780cis cells. Blue dots depict significantly decreased metabolites in A2780cis cells. Gray dots depict metabolites without significant differences. See also Table S2. e Levels of glutamine (Gln), glutamate (Glu), and glutathione (GSH) in A2780 and A2780cis cells. Data are shown as the mean ± SD of the three independent experiments. Statistical significance was determined using the Student’s t-test (**p < 0.01, ***p < 0.001)

