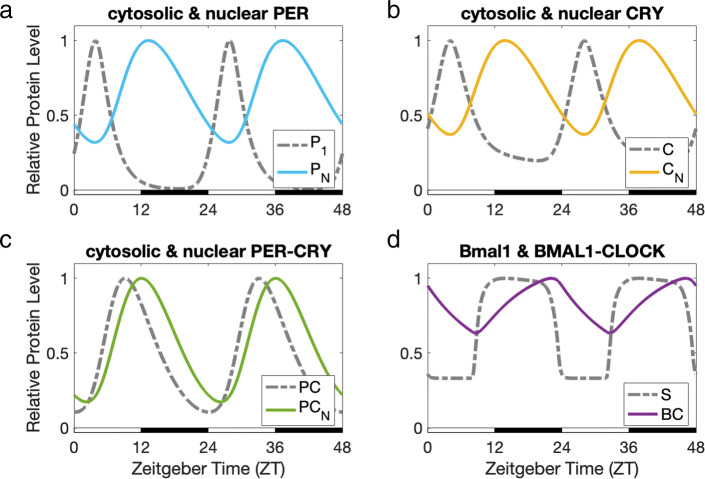
Fig. 2.
Core clock protein levels, relative to their peak values. The peaks of cytosolic PER (P1) and cytosolic CRY (C) (dashed gray curves in panels a and b) follow shortly after the peaks of BMAL1-CLOCK (BC) (solid purple curve in panel d). The delays between P1 and nuclear PER (PN), and between C and nuclear CRY (CN), are around 9 hours (Panels a and b). PN and CN reach maximum expression at the beginning of dark, consistent with experimental data [38]. PN and CN bind and form nuclear PER-CRY (PCN), which inhibits BC through sequestration. Thus, when PCN peaks at 12 hours Zeitgeber time (ZT12), the expression levels of P1 and C are significantly reduced. Additionally, CN directly inhibits the production of P1 and C during night, as proposed in [17]

