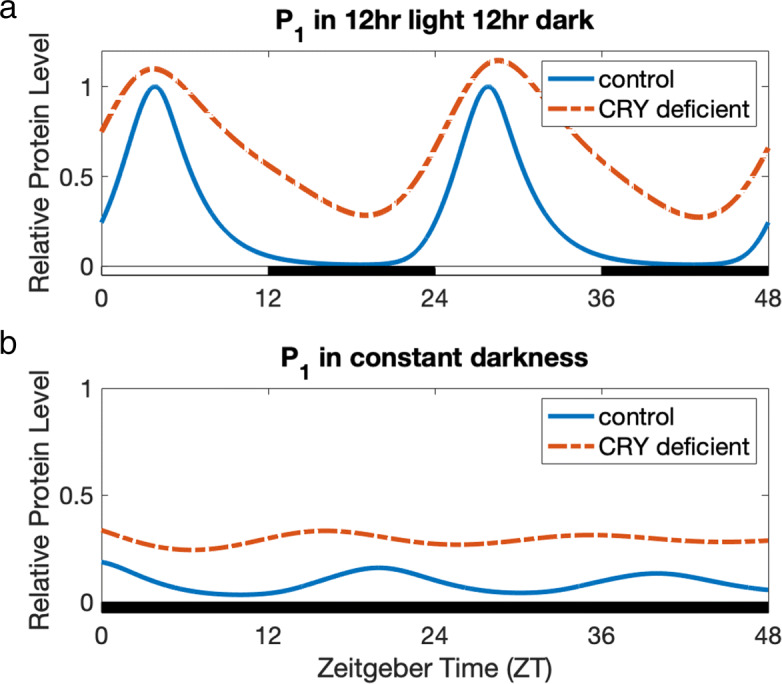
Fig. 3.

Impact of CRY deficiency on P1 in 12hr light 12hr dark (Panel a) and in constant darkness (Panel b). a P1 in 12hr light 12hr dark. The expression level of cytosolic PER (P1) in the model under 12hr light 12hr dark (blue curve) and the expression of P1 in the CRY deficient model under 12hr light 12hr dark (dashed orange curve) are graphed relative to the peak value of P1 under 12hr light 12hr dark (blue curve). We model CRY deficiency by reducing the production rate of CRY by 95%. In 12hr light 12hr dark conditions, CRY deficiency results in nearly diurnal oscillations and elevation in the expression level of P1, as found in mouse SCN experiments [40, 41]. b P1 in constant darkness. The expression level of P1 in the model under constant darkness (blue curve) and the expression of P1 in the CRY deficient model under constant darkness (dashed orange curve) are graphed relative to the peak value of P1 under 12hr light 12hr dark (Panel a, blue curve). It is known that Per gene expression is light-induced [34–36]. In constant darkness, P1 expression is still rhythmic, but greatly reduced in comparison to expression levels under 12hr light 12hr dark conditions. This is consistent with data for mice previously entrained to a 12hr light 12hr dark cycle, and then placed under constant darkness [11, Figure 2c]. Our model also displays a shorter period length in constant darkness, as observed in the mouse circadian oscillator [39]. Our model predicts that under constant darkness and CRY deficiency, the circadian oscillations of P1 (dashed orange curve) will be disrupted and nearly constant. This is consistent with data that have shown immediate arrythmicity and near constant PER expression levels in CRY null mutant mice under constant darkness [40, 41]
