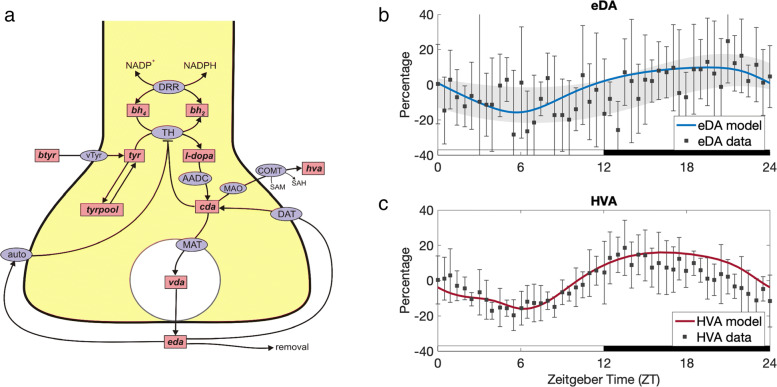
Fig. 6.
Circadian rhythms of extracellular dopamine (eDA) and homovanillic acid (HVA). The mathematical model in this paper was used to compute the (scaled) expression levels of TH, ETH(t), and MAO, EMAO(t), as functions of time over a 24 hour period, 12 hours light and 12 hours dark. Then, the mathematical model of Best et al. [29] (Panel a) was used to compute predicted concentrations of eDA and HVA over the 24 hour period. a The DA Model of synthesis, release, reuptake, and control by autoreceptors. Rectangular boxes indicate substrates and blue ellipses contain the acronyms of enzymes or transporters. Full details of the mathematical model are in [29]. Abbreviations: btyr, blood tyrosine; bh2, dihydrobiopterin; bh4 tetrahydrobiopterin; tyr tyrosine; l-dopa, 3,4-dihyroxyphenylalanine; cda, cytosolic dopamine; vda, vesicular dopamine; eda, extracellular dopamine; hva, homovanillic acid; trypool, the tyrosine pool; vTyr, neutral amino acid transporter; DRR, dihydrobiopterin reductase; TH, tyrosine hydroxylase; AADC, aromatic amino acid decarboxylase; MAT, vesicular monoamine transporter; DAT, dopamine transporter; auto, D2 dopamine auto receptors; MAO monoamine oxidase; COMT, catecholamine O-methyl transferase. b Predicted time course of eDA concentration compared to data. The model prediction of eDA diurnal variation relative to its average concentration (blue curve) corresponds well to the measurements of Castañeda et al. [16] using microdialysis in the rat striatum. Experimental data from [16] of eDA concentration relative to its average value is plotted with black squares. The error bars represent standard deviation. The gray shaded region outlines the trend of the experimental data; see “Validating the model” for details. Consistent with the data, the model curve of eDA concentration is low during light and high during dark. RMSE=10.05%.c Predicted time course of HVA concentration compared to data. The model prediction of HVA concentration (red curve) also follows the diurnal pattern observed in experimental data from [16], plotted with black squares. The error bars represent standard deviation. The model curve is almost entirely within one standard deviation of each data point. HVA concentration drops to about 16 percent below its average value during light, and about 16 percent above during dark. RMSE=6.38%. The results shown in Panels b and c give strong confirmation that the REV and ROR mechanisms reviewed in [20] and investigated in [12, 13, 15] are sufficient to explain the effects of the circadian clock on the dopaminergic system

