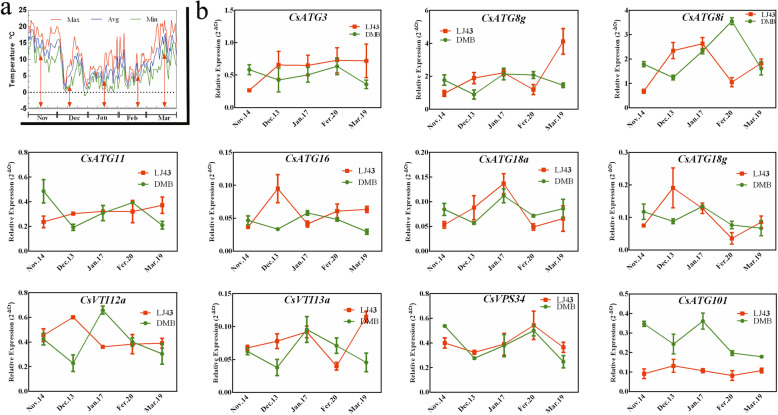
Fig. 7.
Expression analysis of CsARGs during CA periods in 2018–2019. a Changes in air temperature from November 2018 to March 2019. The maximum (Max), average (Avg) and minimum (Min) daily temperatures were respectively indicated by red, blue and green colored lines. The red arrows represent sampling days. b The relative expression levels of 11 CsARGs in two tea cultivars during CA periods in 2018–2019. The expression profiles of CsARGs in two tea cultivars were displayed with different colored lines. The results were calculated by using the 2–ΔCt method with CsPTB as the actin gene. Data are shown as the means ± SE (n = 3)

