
Figure 2. Distribution of Cities with Data on PM2.5.
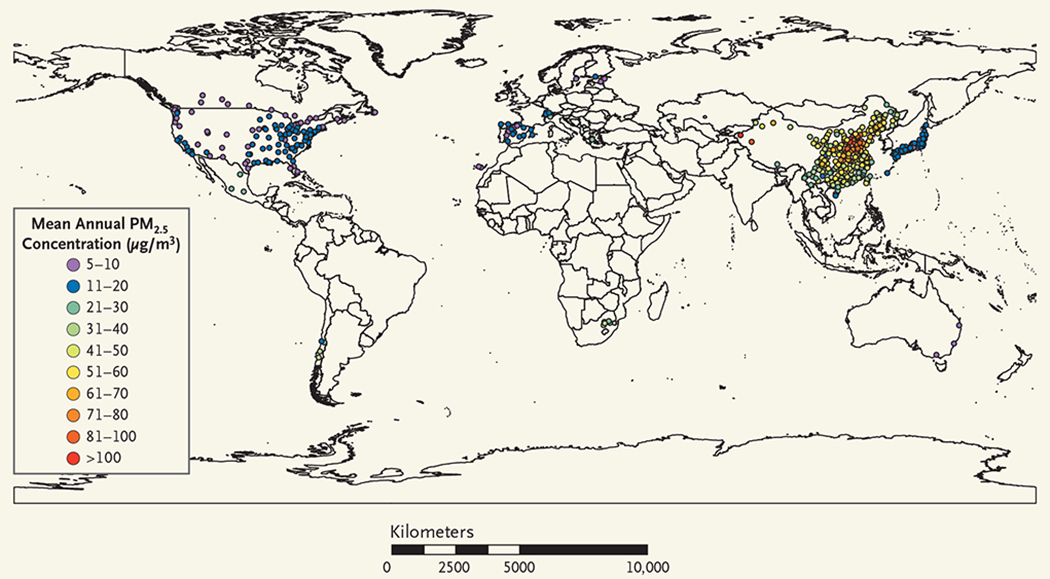
Shown is the geographic distribution of the 499 cities in the 16 countries and regions that had data on particulate matter with an aerodynamic diameter of 2.5 μm or less (PM2.5) and were included in the analysis. Also shown are the annual mean PM2.5 concentrations. See the interactive map, available at NEJM.org.