FIG. 1.
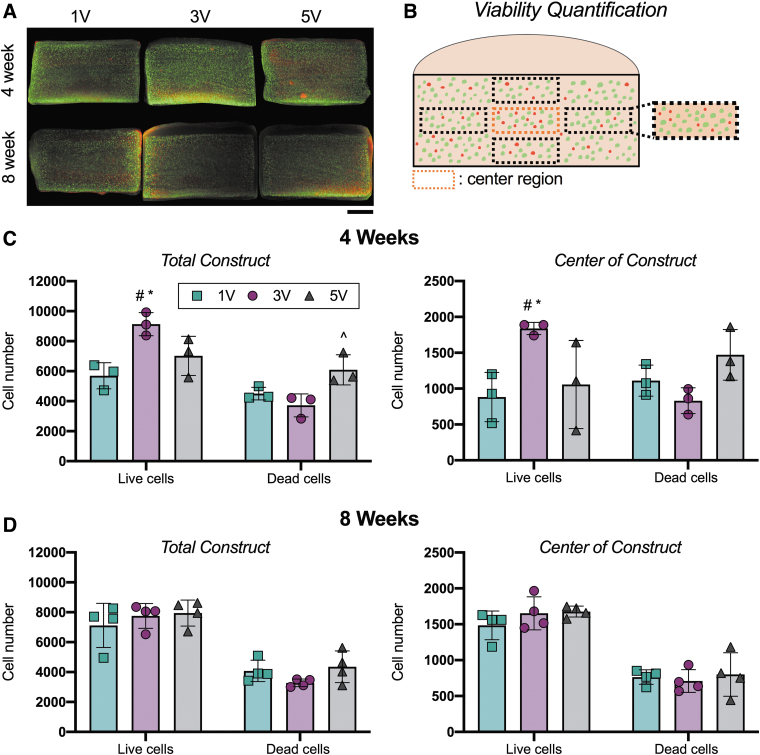
Construct viability with different culture media volumes over time. (A) Representative live/dead images at 4 and 8 weeks. Scale bar = 1 mm. (B) Schematic of viability quantification. Five images were averaged for the total construct measure. Only the center region was reported for the center viability. (C, D) Live and dead cell number throughout the total constructs and in the center of the constructs after 4 and 8 weeks of culture. Mean ± standard deviation. #Versus 1V constructs within cell category [live, dead]; ^versus 3V within cell category; *versus 5V within cell category, p < 0.05. n = 3–4/group. Color images are available online.

