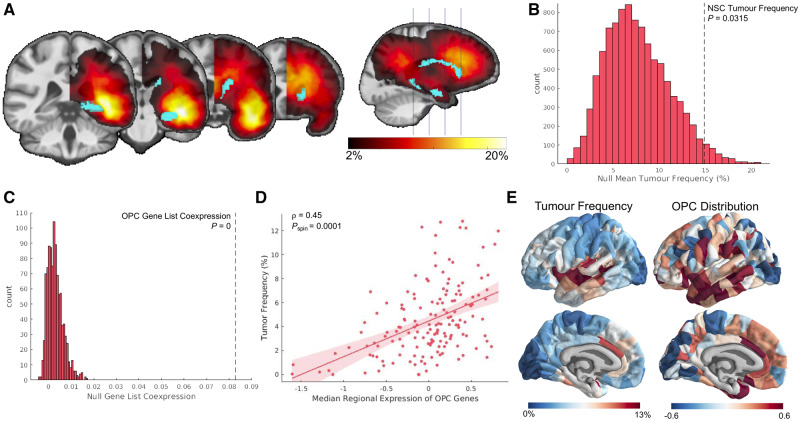
Figure 3.
Gliomas localize to brain regions enriched with stem-like cells. (A) Visualization of the parcel masks representing the hippocampus and caudate superimposed on the mirrored tumour frequency map. (B) Average tumour frequency across the hippocampus and caudate (represented as the dotted black line) compared to a distribution of average tumour frequency across 10 000 sets of two randomly chosen parcels. (C) Co-expression among genes within the OPC gene list compared to co-expression among 10 000 identically-sized sets of genes. (D) Correlation between OPC distribution across cortex and glioma frequency (ρ = 0.45; Pspin = 0.0001). (E) Visualization of glioma frequency and OPC distribution on the cortical surface.

