
FIGURE 4.
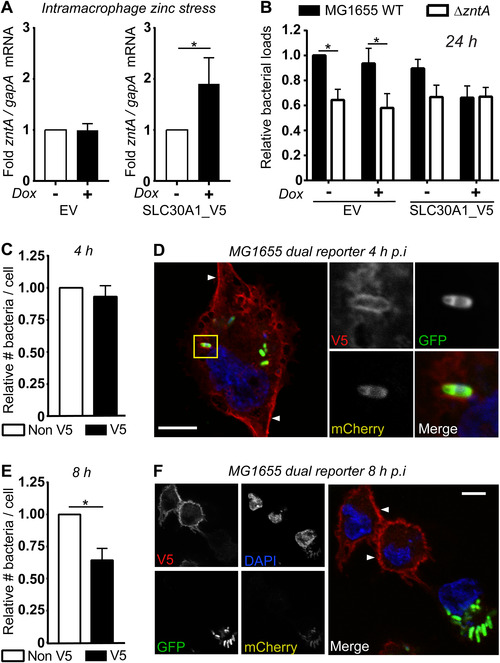
SLC30A1_V5 promotes a zinc stress response and bacterial killing in THP‐1 cells, and localizes to both the plasma membrane and compartments containing zinc‐stressed E. coli. (A–F) PMA‐differentiated THP‐1 cells stably transduced with lentivirus expressing either empty vector (EV) or SLC30A1_V5 were left unstimulated (‐) or stimulated with (A and B) 100 ng/ml or (C–F) 500 ng/ml doxycycline (Dox) for 24 h. After washing, THP‐1 cells were infected with (A) MG1655 or (B) MG1655 and MG1655ΔzntA (MO1 100) for 1 h, with gentamicin exclusion used to remove extracellular bacteria. (A) At 8 h p.i., cells were lysed, total RNA was isolated, and mRNA levels of zntA (relative to the bacterial housekeeping gene gapA) determined by qPCR. In each case (EV or SLC30A1_V5), zntA mRNA levels in E. coli within THP‐1 cells not stimulated with doxycycline were used to calculate the fold change response to enable comparisons across different experiments. (B) Cells were lysed and CFU/mL determined at 24 h p.i. For each experiment, data were normalized to the number of wild‐type bacteria within unstimulated EV THP‐1 cells. (C–F) SLC30A1_V5 THP‐1 cells were washed and infected with MG1655 pGcCzntAp (MOI 100) for 1 h, using an initial spinfection (5 min at 500 × g). Cells were fixed with 4% paraformaldehyde, permeabilized, and then stained with mouse anti‐V5 followed by anti‐mouse Alexa‐647 and DAPI. The average numbers of bacteria within infected cells (V5−ve and V5+ve) were determined via blinded quantification of bacterial GFP fluorescence at (C) 4 and (E) 8 h. Experiments were performed simultaneously, and data were normalized to the number of bacteria within V5−ve cells at each time point. Data are combined from 6 (A) or 5 (B, C, E) independent experiments. Data were analyzed by (A) Wilcoxon matched‐pairs signed rank test, (B) 2‐way ANOVA with Sidak's multiple comparisons test or (C and E) paired t‐test. * P < 0.05, all other comparisons were not significant. (D and F) Depict individual V5+ve THP‐1 cells infected with MG1655 pGcCzntAp at (D) 4 or (F) 8 h p.i., representative of 5 independent experiments. Scale bar represents 10 μm, white arrows indicate plasma membrane, yellow box indicates inset displayed on right